
FIGURE 2.
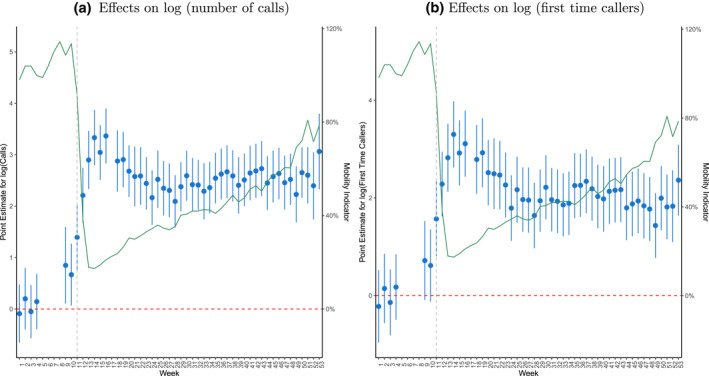
Event‐study Analysis. The green line shows the simple average of walking, driving, and public transit mobility indicators shown in Figure 1. Blue dots correspond to the point estimates obtained using Equation (1), and blue bars show the associated 95 percent confidence intervals. The vertical dashed line marks week 11, when mobility restrictions were first imposed. Weeks 6–8 are missing because telemedicine calls were not recorded those weeks in 2019. Week 17 is missing because telemedicine calls were not recorded that week in 2020