

Abstract
Small cell lung cancer (SCLC) accounts for approximately 13% of all lung cancer cases. Small cell lung cancer is characterized by frequent relapse, and current treatments lack tumor specificity. Arginine is a non‐essential amino acid for human normal cells but critical to some tumor cells that cannot synthesize arginine. Therefore, arginine deprivation has become a potential therapeutic option for selected tumors. BCT‐100 is a pegylated arginase that has documented anticancer activity in arginine auxotrophic tumors, such as melanoma, hepatocellular carcinoma, and acute myeloid leukemia. One of the resistance mechanisms to arginase treatment is overexpression of argininosuccinate synthetase (ASS1) and ornithine transcarbamylase (OTC), two important enzymes in the urea cycle. We selected 9 SCLC and 1 non‐small cell lung carcinoma cell lines to determine the growth inhibition effects of BCT‐100 and established that cell lines with low expression of ASS1 and OTC are relatively sensitive to BCT‐100 treatment. Knocking down OTC in a H841 cell line could potentiate its sensitivity to BCT‐100 treatment. Arginine concentration was sharply decreased, accompanied by apoptosis through oxidative stress as well as G1 cell cycle arrest. In addition, BCT‐100 showed an anticancer effect on H446 and H510A xenograft models by lowering arginine levels and inducing apoptosis.
Keywords: apoptosis, BCT‐100, G1 cell cycle arrest, oxidative stress, small cell lung cancer
Abbreviations
- ADI
arginine deiminase
- ALL
acute lymphoblastic leukemia
- ASS1
argininosuccinate synthetase
- CDK
cyclin‐dependent kinase
- CMFDA
5‐chloromethylfluorescein diacetate
- DHE
dihydroethidium
- GSH
glutathione
- H2DCFDA
2′,7′‐dichlorodihydrofluorescein diacetate
- NSCLC
non‐small cell lung cancer
- OTC
ornithine transcarbamylase
- PARP
poly (ADP‐ribose) polymerase
- rhArg
recombinant human arginase
- ROS
reactive oxygen species
- SCLC
small cell lung carcinoma
- Smac
second mitochondria‐derived activator of caspases
- SOD‐1
superoxide dismutase
- TdT
terminal deoxynucleotidyl transferase
- TRXR
thioredoxin reductase 1
1. INTRODUCTION
Small cell lung cancer accounts for approximately 13% of all lung cancer cases and is a malignant tumor with early metastatic spread. Although it has a good initial response to chemotherapy, the majority of patients will experience relapse and their prognosis remains very poor.1, 2 Compared with personalized targeted therapy in NSCLC patients in subgroups with actionable mutations (EGFR, ROS1, and ALK), the standard first‐line treatment of SCLC remains mainly cisplatinum or carboplatin combined with etoposide.3, 4, 5 The adverse events of chemotherapy are by no means negligible, so it is imperative to devise novel drugs against SCLC.
Amino acid depletion has been considered a form of targeted therapy for selected tumors, and amino acid auxotrophic tumors are sensitive to treatment with corresponding depleting enzymes. The most notable prototype is asparaginase that has been clinically applied in treating ALL.6, 7 Asparagine is a non‐essential amino acid to normal cells, but vital to ALL cells for growth and proliferation. Asparagine deprivation is therefore selectively cytotoxic to ALL cells, while sparing normal cells.
Similarly, arginine is another amino acid that is non‐essential to normal cells but crucial to some tumor cells. It plays an important role in cellular functions such as protein synthesis, nitric oxide production, and polyamine production.8 Biologically, arginine can be metabolized by three enzymes: arginase, ADI, and arginine decarboxylase. There are primarily two ways to induce arginine depletion. One is ADI, an enzyme obtained from mycoplasma that catabolizes arginine to citrulline and ammonia and has been reported to have a powerful antitumor effect in ASS1‐deficient cancers including HCC, prostate cancer, melanoma, and leukemia.9, 10, 11, 12 Another is rhArg, an enzyme that can degrade arginine to ornithine and urea and has shown anticancer activity in certain tumors.13, 14 Both of these agents are modified by PEG, which can reduce their immunogenicity and enhance bioavailability.15, 16 The main difference between ADI and rhArg is that the former has little antitumor effect against tumors expressing ASS1, whereas rhArg can be effective against these tumors. Ornithine transcarbamylase is another crucial enzyme in the urea cycle and catalyzes ornithine to citrulline, and it might explain resistance to rhArg.17
BCT‐100, one type of pegylated rhArg, has shown a significant anticancer effect against several tumors and has completed formal phase I/II clinical trials in the treatment of HCC patients with encouraging results.18 Few studies have highlighted the role of BCT‐100 in SCLC. We explored the mechanism of arginine depletion with BCT‐100 in SCLC as a promising therapeutic approach.
2. MATERIALS AND METHODS
2.1. Cell lines and culture
A panel of 9 SCLC cell lines (NCI‐H69, DMS79, NCI‐H187, NCI‐H209, NCI‐H446, NCI‐H510A, NCI‐H526, NCI‐H841, and SW1271) and 1 NSCLC cell line (A549) were purchased from ATCC (Manassas, VA, USA). All cell lines were maintained on RPMI‐1640 medium (Gibco, Life Technologies, Carlsbad, CA, USA) supplemented with 10% FBS (Gibco) in a humidified atmosphere of 5% CO2 at 37°C.
2.2. Pegylated recombinant human arginase (BCT‐100)
BCT‐100 was kindly provided by Bio‐Cancer Treatment International Limited, Hong Kong.
2.3. Western blot analysis
Treated cells were harvested, washed, and resuspended in RIPA lysis buffer (10 mmol/L Tris‐buffer [pH 7.6], 1.5 mmol/L MgCl2, 1 mmol/L EDTA, 10 mmol/L KCl, and 1 mmol/L PMSF) with the addition of protease inhibitor for 1 hour. A tissue protein extraction reagent kit purchased from Thermo Fisher Scientific (Waltham, MA, USA) was used to extract protein from xenografts. Supernatants were collected after centrifugation (10 000 g, 4°C, 30 minutes). Protein concentration was measured by the Bradford Protein Assay Kit (Bio‐Rad, Berkeley, CA, USA). Protein (30‐60 μg) was loaded into 8%‐15% SDS‐PAGE and electroblotted onto nitrocellulose membranes (GE Healthcare, Buckinghamshire, UK). The membranes were blocked for 1 hour at room temperature in PBS containing 5% non‐fat dry milk plus 0.1% Tween‐20 (PBST) and incubated overnight at 4°C with monoclonal or polyclonal primary antibodies (ASS1, OTC, cleaved PARP, catalase, SOD‐1 [Santa Cruz Biotechnology, Dallas, TX, USA], PEG [RevMAb, San Francisco, CA, USA], β‐actin [Sigma‐Aldrich, St. Louis, MO, USA], caspase 3, cleaved caspase 3, cytochrome C, Smac, COX IV, TRXR1, cyclin A2, cyclin B1, cyclin E1, cyclin E2, CDK2 and CDK4 [Cell Signaling Technology, Danvers, MA, USA]). Horseradish peroxidase‐conjugated secondary antibodies (Cell Signaling Technology) were applied, and membranes incubated for 1 hour at room temperature. Detection was undertaken using an enhanced chemiluminescence kit (GE Healthcare). Quantification was carried out using GelQuantNET software (Biochem Lab Solutions, San Francisco, CA, USA).
2.4. Cell viability assay
Small cell lung cancer cells were seeded in a 96‐well plate, approximately 104/well. After drug exposure, 10 μL MTT (0.5 mg/mL) (Sigma‐Aldrich) was added to each well for 3 hours, followed by triple lysis solution (10% SDS, 5% isobutanol, and 0.012 mol/L HCl in water), 100 μL/well for 2 hours. Optical density was measured at 570 nm using a microplate reader FluoStar Optima (BmgLabtec, Ortenberg, Germany).
2.5. Arginine concentration detection
The arginine level in cells, serum, and tumor was measured using an L‐arginine ELISA kit purchased from Immundiagnostik (Bensheim, Hessen, Germany). The procedure was carried out according to the manufacturer's instructions. In brief, derivatized samples and standards were incubated with L‐arginine antibody overnight at 4°C, followed by incubation with peroxidase conjugate for 1 hour at room temperature, tetramethylbenzidine substrate for 10 minutes in the dark. Wash buffer was needed between every step and stop solution added to halt the reaction. Absorbance (450 nm), using a reference (620 nm), was measured using a microplate reader FluoStar Optima.
2.6. Small interfering RNA and shRNA transfection
Knockdown of OTC was carried out by siRNA; all related reagents were purchased from Santa Cruz Biotechnology. Briefly, a mixture of siRNA and transfection reagent was incubated with cells for 6 hours, then changed to complete medium for 48 hours of incubation. Silencing of ASS1 (shRNA) was achieved using a lentiviral particles kit bought from Santa Cruz Biotechnology. In brief, pretreatment was with polybrene prior to addition of lentiviral particles and incubation for 24 hours. Mixture was then removed to complete medium for a further 48 hours’ incubation. Puromycin dihydrochloride was used to select the stable ASS1‐silenced cell line. Corresponding protein was detected by Western blot, and cell viability after siRNA or shRNA was confirmed by MTT assay.
2.7. Annexin V/7‐AAD staining
Apoptosis was determined by flow cytometry using a PE‐conjugated annexin V/7‐AAD kit (BD Biosciences, San Jose, CA, USA). Briefly, cells were harvested, washed, and resuspended in binding buffer provided in the kit. After 15 minutes’ incubation of annexin V/7‐AAD at room temperature, samples were measured using a Cytomics FC 500 analyzer with FL2/FL4 channels (Beckman Coulter, Brea, CA, USA).
2.8. Reactive oxygen species and GSH measurement
We used H2DCFDA and DHE (Invitrogen, Thermo Fisher Scientific) to test hydrogen peroxide (H2O2) and superoxide, respectively. Briefly, treated cells were harvested, washed, and incubated with H2DCFDA (1 μmol/L) or DHE (1 μmol/L) in medium without FBS for 30 minutes at 37°C following flow cytometry analysis. Glutathione content was measured by CMFDA (Invitrogen). Treated cells were collected, washed, and incubated with CMFDA (5 μmol/L) for 30 minutes at 37°C in FBS‐free medium, then changed to complete medium for a further 30 minutes’ incubation prior to flow cytometry analysis.
2.9. Tumor suppression effect of BCT‐100 using xenograft models
Xenograft models were established by s.c. injection of 107 cells into nude mice (4‐5 weeks old, 10‐14 g, female, BALB/cAnN‐nu; Charles River Laboratories, Wilmington, MA, USA). When the tumor reached a mean group size of 40‐60 mm3, mice were randomized to one of three groups. Both PBS and BCT‐100 (20 and 60 mg/kg) were injected i.p. twice a week. Tumor size was calculated according to the following formula (size = length × width × depth/2).19 The relative tumor volume (RTV) was calculated by the formula: RTV =V n/V 0, where V n was tumor size on day n, and V 0 was tumor size on the first day of treatment. Mice were killed when the tumor volume reached 600 mm3, considered a humane end‐point. The study protocol was approved by the Committee on the Use of Live Animals in Teaching and Research of the University of Hong Kong (CULATR: 3704‐15) (Hong Kong, China).
2.10. Cell apoptosis assay
The TUNEL assay was undertaken using a Click‐iT Plus TUNEL Assay kit (Life Technologies) according to the standard protocol provided by the manufacturer. Tissue deparaffinization, fixation, and permeabilization were required before the TUNEL assay. Tumor sections were immersed in TdT reaction buffer, then changed to new TdT reaction buffer that contained EdUTP, TdT, and TdT enzyme. Samples were incubated with TUNEL reaction cocktails followed by DAPI (Life Technologies) staining. Images were captured using a Nikon Ni‐U fluorescence microscope (Nikon, Tokyo, Japan).
2.11. Immunofluorescence staining
Deparaffinized, fixed, and permeabilized tumor sections were blocked with 3% BSA for 1 hour at room temperature, followed by incubation with PEG (RevMAb) and cytokeratin 1 (Santa Cruz Biotechnology) antibody overnight at 4°C. After washing with PBST for 30 minutes, Alexa Fluor anti‐mouse or anti‐rabbit (Life Technologies) antibody was applied followed by incubation for 1 hour protected from light. The slides were mounted with Prolong Gold anti‐fade reagent with DAPI (Life Technologies). Pictures were obtained using a Nikon Ni‐U fluorescence microscope.
2.12. Statistical analysis
All data were obtained from at least three independent experiments and are shown as mean ± SD. Statistical analysis of data was carried out using Student's two‐tailed t test by Prism (GraphPad Software, La Jolla, CA, USA).
3. RESULTS
3.1. Sensitivity of SCLC to BCT‐100 correlated with expression of ASS1 and OTC
Argininosuccinate synthetase and OTC are two essential enzymes for arginine synthesis in the urea cycle. We tested the basal expression of ASS1 and OTC protein expression levels in a panel of 9 SCLC cell lines (H69, DMS79, H187, H209, H446, H510A, H526, H841, and SW1271) using western blot analysis (Figure 1A). Expression of ASS1 was relatively high in H69, DMS79, and H510A cells, whereas OTC showed high expression in H841 and SW1271 cells. In addition, NSCLC A549 cells were included in this study as an example with intact urea cycle, due to high expression of both ASS1 and OTC as previously reported (Figure 1A).20 To evaluate the cell viability of BCT‐100 in these SCLC and NSCLC cell lines, all cell lines were exposed to increasing concentrations of BCT‐100 for 3 days. Most SCLC cells were sensitive, whereas NSCLC A549 cells were resistant to BCT‐100 treatment. The IC50 values in H69, DMS79, H187, H209, H446, H510A, H526, H841, SW1271, and A549 cells were 46.2 ± 5.6, >1000, 24.0 ± 6.4, 8.6 ± 0.8, 18.0 ± 0.7, 18.2 ± 4.0, 10.1 ± 0.7, >1000, 49.2 ± 7.4, and >1000 mU/mL, respectively (Figure 1B).
Figure 1.

Basal expression of argininosuccinate synthetase (ASS1) and ornithine transcarbamylase (OTC), sensitivity of 9 small cell lung carcinoma (SCLC) cell lines (H69, DMS79, H187, H209, H446, H510A, H526, H841, and SW1271) and 1 non‐small cell lung carcinoma (NSCLC) (A549) cell line to BCT‐100 and OTC knockdown experiment in H841 cells. A, Basal expression of ASS1 and OTC was tested in 9 SCLC cell lines and one NSCLC cell line by western blot. B, MTT assay was used to determine the cell growth inhibitory effect of BCT‐100 on SCLC cell lines and NSCLC cell line for 72 hours. C, Relative expression of OTC was decreased by OTC siRNA in H841 cells. D, Sensitivity to BCT‐100 treatment was increased in OTC knockdown H841 cells. E, Caspase 3 cleavage was observed in BCT‐100 treatment arm in OTC knockdown H841 cells. β‐Actin was used as loading control (Con)
In order to explore the role of ASS1 and OTC in BCT‐100 treatment, we used siRNA to knock down OTC in H841 cells (Figure 1C). Knockdown of OTC increased sensitivity to BCT‐100 of H841 cells, and cleaved caspase 3 was upregulated in the OTC‐silenced group after BCT‐100 exposure for 3 days (Figure 1D,E). Interestingly, knockdown of OTC in SW1271 cells (with high basal OTC expression) resulted in limited enhancement in sensitivity to BCT‐100 (Figure S1). Silencing ASS1 by shRNA in H69 and H510A cells did not affect sensitivity to BCT‐100 treatment (Figure S1).
H446, H510A, and H526 cell lines were selected as model cell lines in the following experiments because they were relatively sensitive to BCT‐100 treatment.
3.2. Apoptosis induced by BCT‐100 was accompanied by arginine decrease in SCLC
As BCT‐100 is a pegylated recombinant human arginase, PEG was used to indicate the accumulation and location of BCT‐100 in vitro and in vivo. Intracellular BCT‐100 was present following BCT‐100 treatment in H446, H510A, and H526 cells in a dose‐dependent manner (Figure 2A). Intracellular arginine concentration was significantly decreased in a dose‐dependent fashion (Figure 2B). At the same time, we observed apoptosis following BCT‐100 treatment as evidenced by upregulation of cleaved PARP (Figure 2C) and an increase in apoptotic cells as evidenced on annexin V/7‐AAD staining (Figure 2D).
Figure 2.
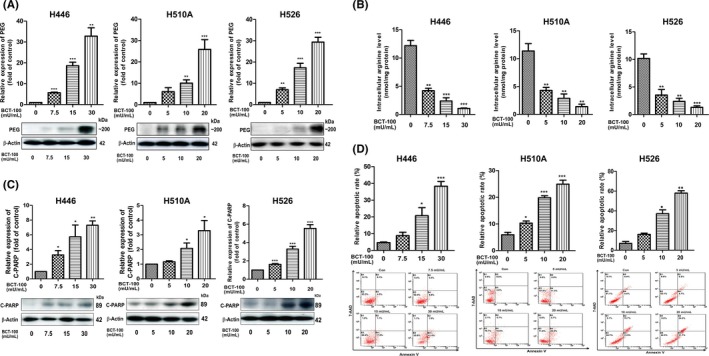
BCT‐100 decreased intracellular arginine concentration and induced apoptosis of H446, H510A, and H526 cells. A,B, Intracellular PEG was accumulated (A) and intracellular arginine concentration (B) was decreased following BCT‐100 treatment for 72 hours. C, Cleaved PARP (C‐PARP) was upregulated after BCT‐100 treatment for 72 hours. D, Apoptotic cells were increased by BCT‐100 treatment, evidenced by annexin V and 7‐AAD staining and flow cytometry analysis. Data are represented as mean ± SD of three independent experiments. *P < .05, **P < .01, ***P < .001, as evaluated by Student's t test
3.3. Effect of BCT‐100 on ROS production and GSH content
2′,7′‐Dichlorodihydrofluorescein diacetate and DHE are probes used to indicate intracellular hydrogen peroxide (H2O2) and superoxide (O2 −), respectively. We found that BCT‐100 greatly induced H2O2 (Figure 3A) and O2 − (Figure 3B) production in the BCT‐100 treatment arms. The GSH level, stained by CMFDA, was decreased in a dose‐dependent manner following BCT‐100 treatment (Figure 3C). Moreover, SOD‐1 and TRXR were also decreased in a dose‐dependent fashion following BCT‐100 exposure (Figure 3D).
Figure 3.

Apoptosis induced by BCT‐100 was mitochondrial‐dependent and accompanied by reactive oxygen species production. A‐C, Elevation of H2O2 (A) and O2 − (B) as well as decreased glutathione (GSH) level (C) was observed after BCT‐100 treatment for 72 hours. D, Downregulation of superoxide dismutase (SOD‐1) and thioredoxin reductase 1 (TRXR) was induced after BCT‐100 treatment for 72 hours. E, Mitochondrial membrane depolarization was elevated in BCT‐100‐treated cells. F, Cytochrome C (Cyt C) and Smac were released to cytosol from nucleus following BCT‐100 treatment for 72 hours. COX IV and β‐actin were used as loading control in mitochondrion (Mito) and cytosol fraction, respectively. Data are shown as mean ± SD of three independent experiments. *P < .05, **P < .01, ***P < .001, as evaluated by Student's t test
3.4. Mitochondrial membrane depolarization and mitochondria‐dependent apoptosis triggered by BCT‐100 treatment
JC‐1 staining revealed that H446, H510A, and H526 cells were experiencing mitochondrial membrane depolarization following BCT‐100 exposure for 3 days (Figure 3E). Smac and cytochrome C are mitochondrial biomarkers that play a crucial role during apoptosis. Both Smac and cytochrome C were released from mitochondrion to cytosol in a dose‐dependent fashion (Figure 3F). In addition, a ROS scavenger, N‐acetylcysteine, could reverse the apoptosis triggered by BCT‐100, and GSH inhibitor, buthionine sulfoximine, could potentiate the cytotoxic effect of BCT‐100 treatment (Figure S2).
3.5. Cell cycle arrest in SCLC after exposure to BCT‐100
Cyclin A2, cyclin B1, cyclin E1, cyclin E2, CDK2, and CDK4 were downregulated in a time‐dependent manner. This indicated that G1 cell cycle arrest was induced by BCT‐100 (Figure 4A). Flow cytometry indicated that BCT‐100 induced G1 cell cycle arrest in SCLC cells (Figure 4B).
Figure 4.

G1 cell cycle arrest was induced by BCT‐100 in H446, H510A, and H526 cells. Cells were treated with BCT‐100 in 15 mU/mL (H446) or 10 mU/mL (H510A and H526) and harvested at different time points. A, Expression of cyclin A2, cyclin B1, cyclin E1, cyclin E2, cyclin‐dependent kinase (CDK)2, and CDK4 was suppressed following BCT‐100 treatment. B, G1 cell cycle arrest was observed by cell division distribution using flow cytometry. All data are mean ± SD of three independent experiments. *P < .05, **P < .01, ***P < .001, as evaluated by Student's t test
3.6. Suppression of tumor growth by BCT‐100 in SCLC xenograft models
In both H446 and H510A xenograft models, BCT‐100 significantly inhibited tumor growth compared with the control group (Figure 5A). Median survival was prolonged from 15.5 days (control arm) to 21 days (60 mg/kg arm) in the H446 xenograft, and from 18 days (control group) to 25 days (60 mg/kg group) in the H510A xenograft (Figure 5B). Similar to the in vitro study, we subsequently determined the accumulation of PEG in BCT‐100 treatment arms in both xenograft models (Figure 5C). Serum arginine level declined dramatically from 143.8 ± 12.7 μmol/L (control) to 2.6 ± 0.2 μmol/L (60 mg/kg) in the H446 xenograft, and from 77.1 ± 22.4 μmol/L (control) to 7.3 ± 1.0 μmol/L (60 mg/kg) in the H510A xenograft (Figure 5D). Intratumoral arginine concentrations in these two xenograft models were also decreased in a dose‐dependent manner. The concentration in the control, 20 mg/kg, and 60 mg/kg groups in the H446 xenograft was 11.7 ± 1.3, 7.8 ± 0.5, 0.48 ± 0.07 μmol/L, respectively. In the H510A xenograft, the corresponding arginine level was 10.01 ± 0.9, 3.89 ± 0.5, and 1.26 ± 0.3 μmol/L, respectively (Figure 5E).
Figure 5.

Anticancer effect of BCT‐100 in H446 and H510A xenograft models. A,B, Relative tumor size was inhibited (A) and median survival was prolonged (B) in both H446 and H510A xenografts. C, BCT‐100 was accumulated in BCT‐100 treatment arms (20 mg/kg and 60 mg/kg) in both xenografts. C,D, Serum (D) and intratumoral (E) arginine levels decreased in a dose‐dependent manner. All data are shown as mean ± SD of determinations of 5‐8 mice in each group. *P < .05, **P < .01, ***P < .001, as evaluated by Student's t test. Con, control
3.7. Apoptosis and G1 cell cycle arrest induced by BCT‐100 in vivo
Cleaved PARP was evident in the 60 mg/kg BCT‐100 treatment arm in H446 and H510A xenografts (Figure 6A). We used TUNEL staining to indicate the DNA strand breaks after BCT‐100 treatment. The TUNEL‐positive signals were much higher in the 60 mg/kg group than the control group in both H446 and H510A xenografts (Figure 6B). Cyclin A2, cyclin B1, and CDK4 were decreased in a dose‐dependent fashion in both xenografts (Figure 6A). These results were consistent with in vitro data that indicated G1 cell cycle arrest following BCT‐100 exposure.
Figure 6.

Apoptosis and G1 cell cycle arrest induced by BCT‐100 and localization of BCT‐100 in H446 and H510A xenografts. A, Cleaved PARP (C‐PARP) was upregulated, whereas cyclin A2, cyclin B1, and cyclin‐dependent kinase (CDK)4 were downregulated by BCT‐100 in both H446 and H510A xenografts. B, Apoptotic cells were increased in BCT‐100 group as revealed by TUNEL assay. C, DAPI, cytokeratin 1, and PEG were used to indicate nucleus, cytoplasm, and BCT‐100, respectively. BCT‐100 was mainly located in the cytoplasm. Photographs were obtained at 400× magnification
3.8. Localization of BCT‐100 in H446 and H510A xenografts
As BCT‐100 is conjugated with PEG, its ability to pass through the nuclear membrane is uncertain. We used DAPI, cytokeratin 1, and PEG to indicate the nucleus, cytoplasm, and BCT‐100, respectively. We observed that PEG overlapped with cytokeratin 1 and very little PEG localized to the nucleus, indicating that BCT‐100 was mainly located in the cytoplasm (Figure 6C).
4. DISCUSSION
BCT‐100 showed an inhibitory effect on tumor growth in SCLC and triggered apoptosis through oxidative stress as well as G1 cell cycle arrest in vitro. In H446 and 510A xenograft models, BCT‐100 (60 mg/kg) suppressed tumor growth and prolonged median survival. The intracellular and intratumoral arginine concentrations were sharply decreased in BCT‐100 treatment groups, resulting in cellular apoptosis and G1 cell cycle arrest.
Arginine deprivation is an emerging approach to treat selected tumors.21 As a targeted anticancer therapy, the efficiency of arginine deprivation is related to ASS1 and OTC expression, two critical enzymes in the urea cycle.22 We purchased 9 commercially available SCLC cell lines from ATCC without selection of basal expression of ASS1 or OTC. We observed that cell lines with both ASS1 and OTC negative expression were relatively sensitive to BCT‐100 treatment, whereas 2 cell lines were relatively resistant to BCT‐100 treatment (Figure 1A,B). According to the in vitro data, 7 of the 9 cell lines showed response to BCT‐100 treatment, which indicated that BCT‐100 might be a therapeutic option for most SCLC patients, but not all. Treatment with BCT‐100 should be similar to other therapies, for example, chemotherapy and immunotherapy, that not all patients would obtain a positive response. Arginine deiminase depletes arginine to citrulline, which can be converted back to arginine by ASS1 through the urea cycle. Therefore, high expression of ASS1 is the predominant resistant mechanism to ADI treatment (ie independent of OTC). Previous studies have reported that silencing ASS1 can enhance sensitivity to ADI treatment in an SCLC cell line.23, 24 However, arginase depletes arginine to ornithine, which can only be converted back to arginine through both ASS1 and OTC catalytic mechanisms. As such, high expression of ASS1 and/or OTC is the expected resistant mechanism to pegylated arginase treatment. We found that knockdown of OTC in BCT‐100‐resistant H841 cells increased sensitivity to BCT‐100 (Figure 1C‐E). However, knockdown of OTC in relatively BCT‐100‐sensitive SW1271 cells had limited effect on further enhancing the sensitivity to BCT‐100 (Figure S1). The expression of OTC could play a more important role in BCT‐100 resistant cells than sensitive cells. Nonetheless, knockdown of ASS1 in H69 and H510A cells could not enhance sensitivity to BCT‐100 (Figure S1). As none of the SCLC cell lines in this study expressed both ASS1 and OTC, we included the NSCLC A549 cell line with known expression of both ASS1 and OTC (ie intact urea cycle) to serve as a control. In line with our notion, A549 cells were resistant to BCT‐100 treatment. As expected, BCT‐100 was less effective in depleting intracellular arginine level in A549 cells with an intact urea cycle. In contrast, intracellular arginine concentration was significantly depleted in most of the SCLC cell lines treated with BCT‐100 (Figure S3).
With regard to the mechanisms of drug action, an arginine depletor might play different roles in different cancer cells. Arginine deiminase, the most studied arginine depletor, can induce mitochondrial dysfunction, ROS production, and autophagy in prostate cancer.25 Arginine deiminase can also inhibit the Warburg effect in leiomyosarcoma and melanoma.26 Previous studies have shown that rhArg inhibits tumor growth through autophagy, cell cycle arrest and oxidative stress in HCC and breast cancer.20, 27 The drug resistance mainly involves ASS1 overexpression induced by activation of the Ras/PI3K/ERK pathway.28 In our study, we also observed that the expression of ASS1 in the BCT‐100 treatment arm was much higher than that of the control, both in vivo and in vitro (data not shown), and could serve as a cellular protective mechanism.
It is well known that the balance of ROS is critical to cell proliferation and survival, and too much or too little ROS may cause cell death. Many chemotherapeutic drugs can induce ROS‐dependent apoptosis in cancer cells in vitro and in vivo.29, 30, 31 Our study implies that ROS was boosted following BCT‐100 treatment, and the antioxidant enzyme, GSH, was correspondingly decreased in a dose‐dependent manner (Figure 2). The essential enzymes in oxidative stress such as SOD‐1 and TRXR were downregulated after treatment and are consistent with previous results.32 Mitochondrion is a unique organelle that plays an essential role in various cellular processes such as energy metabolism, cell differentiation, and apoptosis. As the mitochondria were the main site of ROS production, we tested mitochondrial function and change in mitochondrial‐dependent apoptotic biomarker during BCT‐100 treatment. JC‐1 staining showed that mitochondrial membrane depolarization occurred after BCT‐100 exposure. Following mitochondrial stress, both cytochrome C and Smac are released from mitochondria, leading to downstream reactions. Our results showed that these two biomarkers were released from mitochondrion to cytosol (Figure 3F). Taken together, excessive production of ROS was responsible for the apoptosis induced by BCT‐100 treatment.
The cell cycle is a process in which cells duplicate. This cell division consists of interphase and mitosis and is strictly regulated. The cell cycle checkpoint has become a therapeutic target because it is often dysregulated in cancer cells.33, 34 Previous studies showed that arginine depletion could inhibit cell proliferation in human HCC and melanoma by cell cycle arrest.22, 35 It is interesting that the type of cell cycle arrest induced by arginine depletion varies in different cell lines. Arginine deiminase can cause G1 arrest in neuroblastoma and lymphatic leukemia.36 Of note, rhArg can induce G2/M phase arrest and S phase arrest in Hep3B and HepG2 cells, respectively, even though they originate from HCC.22 In our project, results affirmed that cell cycle arrest‐related biomarkers were decreased in a time‐dependent manner, and flow cytometry assay showed that G1 cell cycle arrest was induced after BCT‐100 treatment (Figure 4). As most downregulated proteins were responsible for G1 cell cycle arrest and cell cycle distribution was similar, we believe that BCT‐100 induced apoptosis through G1 cell cycle arrest in SCLC.
As arginine depletion therapy may exert systemic effects by altering the tumor microenvironment, it was necessary to determine the anticancer effect of BCT‐100 in an animal model. We established xenograft models to prove the anticancer effect of BCT‐100 in vivo using H446 and H510A cell lines. Compared with other malignant tumors,27, 35 the concentrations (20 and 60 mg/kg) we selected were relatively low, because these two cell lines were susceptible to BCT‐100 treatment. In addition, the body weight of mice in the BCT‐100 treatment arm did not significantly decrease compared with the control group (data not shown), suggesting that the side‐effects of BCT‐100 might be acceptable. The mechanism in vivo mainly involved apoptosis and G1 cell cycle arrest and was consistent with in vitro data. Although it is connected with PEG, which facilitates its penetration into cells, BCT‐100 is not effective in the nucleus. BCT‐100 is a pegylated recombinant human arginase that has high sequence homology (87%) to mouse arginase. The substrate of both human and mouse arginases is identical (arginine). The effectiveness of BCT‐100 in causing systemic arginine depletion was shown in our study with markedly reduced systemic and intratumoral arginine levels with BCT‐100 treatment.
The formal phase I/II clinical trial of rhArg completed in patients with advanced HCC has been reported. The dosage of rhArg given to patients was 1600 U/kg weekly. The median progression‐free survival in the treatment group was significantly improved in patients who received adequate arginine depletion over 2 months compared with those having adequate arginine depletion less than 2 months (6.4 vs 1.7 months, 95% confidence interval, 1.67‐1.73; P = 0.01).37 The latest study also implied that ADI could prolong progression‐free survival in patients with ASS1‐deficient mesothelioma.38 The side‐effects of arginine deprivation therapy were mainly liver dysfunction, neutropenia, fatigue, and nausea,18, 38 but it generally did not affect the quality of life of treated patients. Further clinical study of arginine deprivation in cancer patients is still in progress.
Nevertheless, we cannot overlook the limitations in our study. Although we tested the sensitivity of BCT‐100 in 9 SCLC cell lines, the number was still limited. It would be important to expand the number of cell lines in the future to confirm our observed anticancer effects of BCT‐100 in SCLC. Because of low toxicity and irritation, PEG has been widely used in the pharmaceutical industry. Many biopharmaceuticals are modified with PEG to enhance bioactivity. Although it would be logical to use PEG as a control in our experiments, we would then lose PEG as a marker to indicate drug distribution and accumulation. In addition, the concentration of PEG used in our study was known to be inert to cells.39
In conclusion, we revealed that BCT‐100 showed an anticancer effect against SCLC through oxidative stress, apoptosis, and cell cycle arrest. This provides a scientific basis for future clinical development of pegylated arginase in the treatment of SCLC.
CONFLICT OF INTEREST
P.N. Cheng is the Chief Executive Officer of Bio‐Cancer Treatment International Limited and holds stocks or shares in Bio‐Cancer Treatment International Limited. The other authors have no conflict of interest.
Supporting information
Xu S, Lam S‐K, Cheng PN‐M, Ho JC‐M. Recombinant human arginase induces apoptosis through oxidative stress and cell cycle arrest in small cell lung cancer. Cancer Sci. 2018;109:3471–3482. 10.1111/cas.13782
REFERENCES
- 1. Torre LA, Siegel RL, Jemal A. Lung cancer statistics. Adv Exp Med Biol. 2016;893:1‐19. [DOI] [PubMed] [Google Scholar]
- 2. Amos CI, Hung R, Bosse Y, et al. P1.04: defining the genetic architecture of lung cancer etiology: track: prevention, early detection, epidemiology and tobacco control. J Thorac Oncol. 2016;11:S182. [Google Scholar]
- 3. Seeber A, Leitner C, Philipp‐Abbrederis K, Spizzo G, Kocher F. What's new in small cell lung cancer ‐ extensive disease? An overview on advances of systemic treatment in 2016. Future Oncol. 2017;13:1427‐1435. [DOI] [PubMed] [Google Scholar]
- 4. Fink TH, Huber RM, Heigener DF, et al. Topotecan/cisplatin compared with cisplatin/etoposide as first‐line treatment for patients with extensive disease small‐cell lung cancer: final results of a randomized phase III trial. J Thorac Oncol. 2012;7:1432‐1439. [DOI] [PubMed] [Google Scholar]
- 5. Igawa S, Shirasawa M, Fukui T, et al. Efficacy of platinum‐based chemotherapy for relapsed small‐cell lung cancer after amrubicin monotherapy in elderly patients and patients with poor performance status. Oncology. 2018;94:207‐214. [DOI] [PubMed] [Google Scholar]
- 6. Song P, Ye L, Fan J, et al. Asparaginase induces apoptosis and cytoprotective autophagy in chronic myeloid leukemia cells. Oncotarget. 2015;6:3861‐3873. [DOI] [PMC free article] [PubMed] [Google Scholar]
- 7. Batool T, Makky EA, Jalal M, Yusoff MM. A Comprehensive Review on L‐Asparaginase and Its Applications. Appl Biochem Biotechnol. 2016;178:900‐923. [DOI] [PubMed] [Google Scholar]
- 8. Wu G, Morris SM Jr. Arginine metabolism: nitric oxide and beyond. Biochem J. 1998;336(Pt 1):1‐17. [DOI] [PMC free article] [PubMed] [Google Scholar]
- 9. Jiang H, Guo S, Xiao D, et al. Arginine deiminase expressed in vivo, driven by human telomerase reverse transcriptase promoter, displays high hepatoma targeting and oncolytic efficiency. Oncotarget. 2017;8:37694‐37704. [DOI] [PMC free article] [PubMed] [Google Scholar]
- 10. Kim RH, Coates JM, Bowles TL, et al. Arginine deiminase as a novel therapy for prostate cancer induces autophagy and caspase‐independent apoptosis. Can Res. 2009;69:700‐708. [DOI] [PMC free article] [PubMed] [Google Scholar]
- 11. Miraki‐Moud F, Ghazaly E, Ariza‐McNaughton L, et al. Arginine deprivation using pegylated arginine deiminase has activity against primary acute myeloid leukemia cells in vivo. Blood. 2015;125:4060‐4068. [DOI] [PubMed] [Google Scholar]
- 12. Yang TS, Lu SN, Chao Y, et al. A randomised phase II study of pegylated arginine deiminase (ADI‐PEG 20) in Asian advanced hepatocellular carcinoma patients. Br J Cancer. 2010;103:954‐960. [DOI] [PMC free article] [PubMed] [Google Scholar]
- 13. Lam SK, Li YY, Xu S, et al. Growth suppressive effect of pegylated arginase in malignant pleural mesothelioma xenografts. Respir Res. 2017;18:80. [DOI] [PMC free article] [PubMed] [Google Scholar]
- 14. Mussai F, Egan S, Higginbotham‐Jones J, et al. Arginine dependence of acute myeloid leukemia blast proliferation: a novel therapeutic target. Blood. 2015;125:2386‐2396. [DOI] [PMC free article] [PubMed] [Google Scholar]
- 15. Feun L, Savaraj N. Pegylated arginine deiminase: a novel anticancer enzyme agent. Expert Opin Investig Drugs. 2006;15:815‐822. [DOI] [PMC free article] [PubMed] [Google Scholar]
- 16. Wang M, Basu A, Palm T, et al. Engineering an arginine catabolizing bioconjugate: biochemical and pharmacological characterization of PEGylated derivatives of arginine deiminase from Mycoplasma arthritidis. Bioconjug Chem. 2006;17:1447‐1459. [DOI] [PubMed] [Google Scholar]
- 17. Cheng PN, Lam TL, Lam WM, et al. Pegylated recombinant human arginase (rhArg‐peg5,000mw) inhibits the in vitro and in vivo proliferation of human hepatocellular carcinoma through arginine depletion. Can Res. 2007;67:309‐317. [DOI] [PubMed] [Google Scholar]
- 18. Yau T, Cheng PN, Chan P, et al. Preliminary efficacy, safety, pharmacokinetics, pharmacodynamics and quality of life study of pegylated recombinant human arginase 1 in patients with advanced hepatocellular carcinoma. Invest New Drugs. 2015;33:496‐504. [DOI] [PubMed] [Google Scholar]
- 19. Epenetos AA, Kousparou C, Filipovic A. Generation of a selectively cytotoxic fusion protein against p53 mutated cancers. BMC Cancer. 2012;12:338. [DOI] [PMC free article] [PubMed] [Google Scholar]
- 20. Wang Z, Shi X, Li Y, et al. Blocking autophagy enhanced cytotoxicity induced by recombinant human arginase in triple‐negative breast cancer cells. Cell Death Dis. 2014;5:e1563. [DOI] [PMC free article] [PubMed] [Google Scholar]
- 21. Kurlishchuk Y, Vynnytska‐Myronovska B, Grosse‐Gehling P, et al. Co‐application of canavanine and irradiation uncouples anticancer potential of arginine deprivation from citrulline availability. Oncotarget. 2016;7:73292‐73308. [DOI] [PMC free article] [PubMed] [Google Scholar]
- 22. Lam TL, Wong GK, Chong HC, et al. Recombinant human arginase inhibits proliferation of human hepatocellular carcinoma by inducing cell cycle arrest. Cancer Lett. 2009;277:91‐100. [DOI] [PubMed] [Google Scholar]
- 23. Kelly MP, Jungbluth AA, Wu BW, Bomalaski J, Old LJ, Ritter G. Arginine deiminase PEG20 inhibits growth of small cell lung cancers lacking expression of argininosuccinate synthetase. Br J Cancer. 2012;106:324‐332. [DOI] [PMC free article] [PubMed] [Google Scholar]
- 24. Qiu F, Huang J, Sui M. Targeting arginine metabolism pathway to treat arginine‐dependent cancers. Cancer Lett. 2015;364:1‐7. [DOI] [PubMed] [Google Scholar]
- 25. Changou CA, Chen YR, Xing L, et al. Arginine starvation‐associated atypical cellular death involves mitochondrial dysfunction, nuclear DNA leakage, and chromatin autophagy. Proc Natl Acad Sci USA. 2014;111:14147‐14152. [DOI] [PMC free article] [PubMed] [Google Scholar]
- 26. Kremer JC, Prudner BC, Lange SES, et al. Arginine deprivation inhibits the warburg effect and upregulates glutamine anaplerosis and serine biosynthesis in ASS1‐deficient cancers. Cell Rep. 2017;18:991‐1004. [DOI] [PMC free article] [PubMed] [Google Scholar]
- 27. Chow AK, Ng L, Sing Li H, et al. Anti‐tumor efficacy of a recombinant human arginase in human hepatocellular carcinoma. Curr Cancer Drug Targets. 2012;12:1233‐1243. [DOI] [PubMed] [Google Scholar]
- 28. Tsai WB, Aiba I, Long Y, et al. Activation of Ras/PI3K/ERK pathway induces c‐Myc stabilization to upregulate argininosuccinate synthetase, leading to arginine deiminase resistance in melanoma cells. Can Res. 2012;72:2622‐2633. [DOI] [PMC free article] [PubMed] [Google Scholar]
- 29. Wangpaichitr M, Wu C, Li YY, et al. Exploiting ROS and metabolic differences to kill cisplatin resistant lung cancer. Oncotarget. 2017;8:49275‐49292. [DOI] [PMC free article] [PubMed] [Google Scholar]
- 30. Shin HJ, Kwon HK, Lee JH, Anwar MA, Choi S. Etoposide induced cytotoxicity mediated by ROS and ERK in human kidney proximal tubule cells. Sci Rep. 2016;6:34064. [DOI] [PMC free article] [PubMed] [Google Scholar]
- 31. Raha D, Wilson TR, Peng J, et al. The cancer stem cell marker aldehyde dehydrogenase is required to maintain a drug‐tolerant tumor cell subpopulation. Can Res. 2014;74:3579‐3590. [DOI] [PubMed] [Google Scholar]
- 32. Park WH. Antiapoptotic effects of caspase inhibitors on H2O2‐treated lung cancer cells concerning oxidative stress and GSH. Mol Cell Biochem. 2017;441:125‐134. [DOI] [PubMed] [Google Scholar]
- 33. Lin AB, McNeely SC, Beckmann RP. Achieving precision death with cell‐cycle inhibitors that target DNA replication and repair. Clin Cancer Res. 2017;23:3232‐3240. [DOI] [PubMed] [Google Scholar]
- 34. Maes A, Menu E, Veirman K, Maes K, Vanderkerken K, Bruyne E. The therapeutic potential of cell cycle targeting in multiple myeloma. Oncotarget. 2017;8:90501‐90520. [DOI] [PMC free article] [PubMed] [Google Scholar]
- 35. Lam TL, Wong GK, Chow HY, et al. Recombinant human arginase inhibits the in vitro and in vivo proliferation of human melanoma by inducing cell cycle arrest and apoptosis. Pigment Cell Melanoma Res. 2011;24:366‐376. [DOI] [PubMed] [Google Scholar]
- 36. Gong H, Zolzer F, von Recklinghausen G, Havers W, Schweigerer L. Arginine deiminase inhibits proliferation of human leukemia cells more potently than asparaginase by inducing cell cycle arrest and apoptosis. Leukemia. 2000;14:826‐829. [DOI] [PubMed] [Google Scholar]
- 37. Yau T, Yao TJ, Chan P, Ng K, Fan ST, Poon RT. A new prognostic score system in patients with advanced hepatocellular carcinoma not amendable to locoregional therapy: implication for patient selection in systemic therapy trials. Cancer. 2008;113:2742‐2751. [DOI] [PubMed] [Google Scholar]
- 38. Szlosarek PW, Steele JP, Nolan L, et al. Arginine deprivation with pegylated arginine deiminase in patients with argininosuccinate synthetase 1‐deficient malignant pleural mesothelioma: a randomized clinical trial. JAMA Oncol. 2017;3:58‐66. [DOI] [PubMed] [Google Scholar]
- 39. Ivens IA, Achanzar W, Baumann A, et al. PEGylated biopharmaceuticals: current experience and considerations for nonclinical development. Toxicol Pathol. 2015;43:959‐983. [DOI] [PubMed] [Google Scholar]
Associated Data
This section collects any data citations, data availability statements, or supplementary materials included in this article.
Supplementary Materials