

Background: Cytosolic branched chain aminotransferase (BCATc) initiates Leu catabolism. In T cells, Leu activates mTORC1, the role of BCATc is unknown.
Results: BCATc stimulates Leu transamination, whereas loss of BCATc expression increases Leu concentrations, mTORC1 signaling, and glycolysis in T cells.
Conclusion: BCATc is a novel immunosuppressive enzyme controlling Leu supply for mTORC1 in T cells.
Significance: A new link is revealed between amino acid metabolism and the immune response.
Keywords: Amino Acid, Amino Acid Transport, Glycolysis, Lymphocyte, Mammalian Target of Rapamycin (mTOR), BCATc, CD4+ T Cells, T Cell Anergy, Leu
Abstract
Here we show that expression of the cytosolic branched chain aminotransferase (BCATc) is triggered by the T cell receptor (TCR) of CD4+ T cells. Induction of BCATc correlates with increased Leu transamination, whereas T cells from the BCATc−/− mouse exhibit lower Leu transamination and higher intracellular Leu concentrations than the cells from wild type (WT) mice. Induction of BCATc by TCR in WT cells is prevented by the calcineurin-nuclear factor of activated T cells (NFAT) inhibitor, cyclosporin A (CsA), suggesting that NFAT controls BCATc expression. Leu is a known activator of the mammalian target of rapamycin complex 1 (mTORC1). mTOR is emerging as a critical regulator of T cell activation, differentiation, and metabolism. Activated T cells from BCATc−/− mice show increased phosphorylation of mTORC1 downstream targets, S6 and 4EBP-1, indicating higher mTORC1 activation than in T cells from WT mice. Furthermore, T cells from BCATc−/− mice display higher rates of glycolysis, glycolytic capacity, and glycolytic reserve when compared with activated WT cells. These findings reveal BCATc as a novel regulator of T cell activation and metabolism and highlight the important role of Leu metabolism in T cells.
Introduction
The branched chain amino acids (BCAAs)2 (Leu, Ile, and Val) are essential for normal growth and development (1). BCAAs promote protein synthesis and are nitrogen donors for Ala and Gln synthesis in skeletal muscle (2). In the central nervous system, they donate nitrogen for excitatory neurotransmitter Glu synthesis (3). Regulation of BCAA catabolism is necessary to ensure an adequate supply of BCAAs for tissue protein synthesis and to prevent buildup of toxic metabolites. Control of BCAA levels occurs at the first two steps in the BCAA degradation pathway, catalyzed by the branched chain aminotransferase isozymes (mitochondrial BCATm and cytosolic BCATc) and branched chain α-keto acid dehydrogenase enzyme complex (BCKDC), respectively (4, 5). The BCATs catalyze the reversible transfer of the α-amino group of a BCAA to α-ketoglutarate, producing the branched chain α-keto acids (BCKAs) and Glu (6, 7). BCKDC catalyzes irreversible oxidative decarboxylation of the BCKAs to produce the branched chain acyl-CoAs and NADH and contains multiple copies of three enzymes: branched chain α-keto acid decarboxylase/dehydrogenase (E1), dihydrolipoyl transcylase (E2), and dihydrolipoamide dehydrogenase (E3) (8). BCKDC is inactivated by phosphorylation of the E1α subunit of the E1 enzyme, catalyzed by a specific kinase (BDK), which is inhibited by the α-keto acid of Leu (KIC, α-ketoisocaproate) (9, 10).
Tight control of BCAA metabolism is also important because the BCAA Leu is a nutrient signal that promotes insulin release from the pancreas (11) and stimulates protein synthesis in skeletal muscle, heart, adipose tissue, and liver (12–14). The stimulatory effects of Leu on protein translation are mediated by mTOR (12, 15, 16). By interacting with different protein partners, mTOR assembles into two complexes: rapamycin-sensitive mTOR complex 1 (mTORC1) and rapamycin-insensitive mTOR complex 2 (mTORC2), and both are involved in phosphorylation of downstream substrates (17). Phosphorylation by mTORC1 promotes the cap-dependent translation by altering the activities of components of the translational machinery such as 4EBP-1, ElF2B, and p70 S6 kinase (18). Leu availability is required for mTORC1 but not mTORC2 activation, as the absence of Leu prevents mTORC1 activation and causes rapid dephosphorylation of the mTORC1 substrates S6K and 4EBP-1 (16). Both complexes, mTORC1 and mTORC2, play essential roles in protein synthesis, cell growth, and survival (18).
It has been demonstrated that mTOR signaling is a critical regulator of the immune function that links cellular metabolism to T cell activation/differentiation and influences the final outcome of the adaptive immune response (19, 20). There is accumulating evidence that Leu and Leu cellular import are involved in T cell activation (21–23). Sinclair et al. (22) showed that the System L transporter, Slc7a5, is a key factor in T cell metabolic reprogramming that directs Leu transport and controls mTORC1 activity (22). Moreover, the Leu antagonist N-acetyl-leucine amide (NALA) inhibits mTORC1 activity and T cell function (23). Similarity, essential amino acid depletion inhibits mTOR and promotes infectious tolerance via generation of regulatory T cells (21).
mRNA for the BCAA catabolic enzyme, BCATc (BCAT1 gene), has been reported to be up-regulated in skin grafts and regulatory T cells (21). In adult mammals, BCATc expression is limited to the nervous system and gonadal tissues; however, BCATc is expressed in proliferating cells of embryonic or cancer origin (8, 24–26). BCATc is thought to be a potential diagnostic marker for aggressive IDHwt glioblastomas (25). In this study, we examined the biochemical and metabolic consequences of changes in BCATc expression during TCR-induced activation in CD4+ T cells. BCATc protein expression increased over 20-fold, whereas the BCATm protein remained unaltered after 24 h of TCR stimulation. The increase in BCATc protein correlated with an increase in cytosolic Leu transamination, with KIC being the main product of Leu metabolism. Using an inhibitor of NFAT, it was determined that NFAT signaling regulated BCATc expression. Finally, using T cells isolated from BCATc−/− mice, we show that loss of cytosolic Leu transamination resulted in increased mTORC1 activity and glycolytic metabolism, which correlated with higher cellular Leu concentrations. Overall, our findings reveal a critical role of TCR-induced BCATc in regulating cytosolic Leu metabolism during T cell metabolic reprogramming.
EXPERIMENTAL PROCEDURES
Mice
All animal experiments were approved by either the IACUC at the Virginia Polytechnic Institute and State University or the Johns Hopkins University Institutional Animal Care and Use Committee guidelines. C57BL/6 and global-Cre mice were purchased from Jackson Laboratories, whereas BCATc−/− mice were generated by breeding heterozygote BCATc floxed mice with global-Cre mice (see below). All mice were given free access to water and a rodent chow diet (Teklad 2018; Harlan, Indianapolis, IN) and kept on a 12-h light/dark cycle.
Generation of Global BCATc−/− Mice
The mouse BCAT1 gene consists of 11 exons (GenBankTM accession number NM_001024468, BCAT1). To disrupt the BCAT1 gene in mice, a 0.5-kb DNA sequence containing exon 6 of BCAT1 gene was flanked by two loxP sites and cloned into pCR4.0 TOPO vector. The 5′ homology arm (5.7 kb) and 3′ homology arm (4.1 kb) were generated and cloned in 3loxP3NwCD vector. After subcloning, the final vector contained 5′ and 3′ homologous arms, 0.5-kb BCATc DNA flanked by loxP sequences, Neo expression cassette (positive selection marker) flanked by loxP sequences, and DTA expression cassette (negative selection marker). The final vector was linearized by NotI and electroporated into C57BL/6 embryonic stem (ES) cells. After completion of ES clone expansion, two clones (Neo selection marker deleted) were injected into C57BL/6 blastocysts and one of the clones generated two male chimeras. The chimeras were bred with WT C57BL/6 mice to produce heterozygote mice. Heterozygotes were identified by PCR genotyping using tail DNA and two primers, VTLoxPF (GTCTGTGGAGGTCTTCAGGTTCAGCTTG) and VTLoxPR (ATCCCAGAAGGTCACCCAAACAAACAAAG), generating two products of 240 and 330 bp; germline transmission was confirmed. The global BCATc knock-out (BCATc−/−) was generated using Cre-mediated deletion of the targeted region of the BCAT1 gene in flox/flox-Cre mice. Cre recombinase activity caused deletions in both copies of the BCAT1 gene and abolished BCATc protein expression. Knock-out and heterozygote mice lacking Neo and Cre genes were identified by PCR-genotyping using tail DNA, and two primers BCAT1For (GTCTGTGGAGGTCTCAGGTCAGCTTG) and BCAT1Rev (CCGGTTCAAGGTCTTCCTGAAGAA) with 2 PCR products: 250 bp for knock-out, 850 bp for WT and both products for heterozygote (Fig. 3).
FIGURE 3.

BCATc protein is not expressed in brain or T cells from global BCATc−/− mice. Tail DNA, genomic PCR analysis of BCATc gene from WT (+/+), heterozygous (+/−), and homozygous (−/−) mice. WT allele is ∼800 bp, whereas the mutant allele is ∼ 250 bp. Brain, Western blotting of BCATc protein from brain samples of WT, heterozygous, or homozygous knock-out mice. CD4+ T Cells, T cells from spleens and lymph nodes of WT and BCATc−/− global mice were isolated and activated with anti-CD3 plus anti-CD28 for 48 h, and expanded with IL-2 for 3 days, subjected to Ficoll gradient purification, and re-activated with anti-CD3 (TCR) for 24 h. Cell extracts were used for Western blotting of BCATc and BCATm with β-tubulin as a loading control. Images are representative of three separate experiments.
Antibodies and Reagents
For flow cytometry, anti-CD4-APC was purchased from e-Bioscience (San Diego, CA). For T cell activation, anti-CD28 (37.51), anti-CD3 (2C11), and interleukin 2 (IL-2) were purchased from BD Biosciences or produced as described (23). Antibodies to P-S6 (Ser240/244), S6, P-4EBP-1 (Thr37/46), 4EBP-1, β-tubulin, and pan-actin were purchased from Cell Signaling Technologies (Danvers, MA). Glut1 antibody was purchased from Santa Cruz Biotechnology. For detection of phospho-E1α, E1α, and E2, an anti-E1α pS293, an anti-E2, and an E1α peptide antibody (27) were used. BCAT isozyme-specific antisera were raised in rabbits using purified recombinant human BCATm and BCATc and affinity purified as described (8, 24). CsA was purchased from Enzo Life Sciences (Farmingdale, NY) and dissolved in dimethyl sulfoxide, rapamycin was purchased from LC Laboratories (Woburn, MA), NALA was purchased from BACHEM (Bubendorf, Switzerland).
T Cell Culture, Expansion and Activation
A.E7, a CD4+ Th1 clone, specific for pigeon cytochrome c peptide-(81–104) (FAGIKKKAERADLIAYLKQATAK) was maintained and expanded as previously described (23). Spleens and lymph nodes from either BCATc−/− or WT littermate mice were passed through a 70-μm strainer to create a single-cell suspension that was used to negatively select CD4+ T cells using a MACS CD4+ T cell isolation kit (Miltenyi Biotec, Auburn, CA) with 86–90% purity as determined by flow cytometry using anti-CD4-APC (e-Bioscience).3 The CD4+ T cells were maintained in T cell medium with the following formulation: 1× RPMI 1640 (CellGro, Manassas, VA) supplemented with 10% FBS (HyClone, South Logan, UT), 2 mm Gln (HyClone), 1× 2-mercaptoethanol (Invitrogen), 100 IU/ml of penicillin, 100 μg/ml of streptomycin (HyClone), and 0.5 mg/ml of gentamicin (Invitrogen). To expand these cells, they were activated with 1 μg/ml of plate-bound anti-CD3 and 2 μg/ml of soluble anti-CD28 for 48 h. Mouse rIL-2 (10 units/ml; BD Biosciences) was then added to the culture and CD4+ T cells were expanded. After 2–4 days, live cells were isolated by a Ficoll gradient (GE Healthcare). These cells were left either un-stimulated or stimulated with 3 μg/ml of plate-bound anti-CD3 with or without 2 μg/ml of soluble anti-CD28.
Microarray Analysis
mRNA was isolated from A.E7 T cell clones that were left un-stimulated or were stimulated with anti-CD3 for 2, 4, and 6 h, or stimulated and then rested 5 days in fresh media and Affymetrix gene chip u74 version 2 was performed as described before (28).
Adoptive Transfer in C3-HA Anergy Model
T cells (6.5+ TCR transgenic) specific for hemagglutinin (HA) were adoptively transferred into mice that express HA as a self-antigen (C3-HA) and mRNA from clonotypic cells was isolated after 3, 6, and 13 days of transfer and interrogated by Affymetrix gene chip analysis as previously described (28, 29).
BCAT Enzyme Activity
Total branched chain aminotransferase activity was measured in solubilized cells at 37 °C in 25 mm potassium phosphate buffer, pH 7.8, using 1 mm α-keto [1-14C]isovalerate and 12 mm Ile as described (7). A unit of enzyme activity was defined as 1 nmol of Val formed per min/mg of protein at 37 °C.
Leu Oxidation and Transamination
After 24 h of incubation, un-stimulated, TCR-stimulated, and co-stimulated T cells were washed twice with Krebs buffer (20 mm HEPES, pH 7.0, 128 mm NaCl, 4.7 mm KCl, 1.2 mm KH2PO4, 1.2 mm MgCl2, 25 mm NaHCO3, 2 mm CaCl2, 5.5 mm glucose) and centrifuged at 900 × g for 10 min. For the Leu oxidation assay, the washed T cells were incubated in Krebs buffer in the presence of 1 mm [1-14C]Leu (specific activity 200 dpm/nmol). The assay was carried out in a 20-ml scintillation vial, and cells were gassed with a 95% O2, 5% CO2 mixture for 20 s, sealed with a rubber stopper, and incubated in Dubnoff metabolic shaker at 37 °C for 120 min. The reaction was stopped by addition of 3% perchloric acid (final concentration); 14CO2 production and formation of [14C]KIC were quantified as described previously (7, 30). To measure KIC in and outside the cells, at the end of the oxidation assay, T cell suspensions were centrifuged for 10 s at 13,200 × g to separate the supernatant (representing the T cell medium) from the T cells. The T cell pellets were re-suspended in fresh Krebs buffer and KIC production in each was determined as described previously (30).
Western Blotting
Cell pellets from T cells were re-suspended in extraction buffer (25 mm HEPES, pH 7.0, 0.4% CHAPS, 1 mm DTT) containing 1 mm EDTA, 1 mm EGTA, 5 mm benzamidine, 0.5 mm microstatin, 33 mm β-glycerophosphate, 0.5 mm thiamine pyrophosphate, 1 mm sodium orthovanadate, 7.2 mm potassium fluoride and 1:100 dilution of Calbiochem protease inhibitor mixture set III (EMD Biosciences, La Jolla, CA). Each extract was sonicated twice, centrifuged at 13,200 × g for 15 min at 4 °C, and supernatants were collected. Protein was determined using a microplate BCA protein assay kit (Thermo Scientific, Rockford, IL). Proteins in the cell extracts (10–100 μg) were separated by SDS-PAGE and transferred to Amersham Biosciences Hybond-P membranes (GE Healthcare) using a Bio-Rad Criterion Blotter (Bio-Rad). Membranes, blocked with either 5% milk (Bio-Rad) or 4% BSA (Fisher) in 1× TBST buffer (20 mm Tris base, 136 mm NaCl, 0.1% Tween 20, pH 7.4) were incubated overnight with antibodies against E1α, phosphorylated E1α (P-E1α), E2, BCATm, BCATc, P-S6, S6, 4EBP-1, P-4EBP1, Glut1, pan-actin, or β-tubulin. The phosphorylated state and total protein levels of S6 and 4EBP-1 were compared by running protein lysates from the same experiment on two separate gels. Proteins were detected using horseradish peroxidase-conjugated secondary donkey anti-rabbit antibody diluted between 1:10,000 and 1:30,000 (Jackson ImmunoResearch Labs, West Grove, PA) and Super Signal West Femto chemiluminescent substrate (Thermo Scientific, Rockford, IL) following an x-ray film exposure. The x-ray films were photographed and the protein bands were quantified using Image J software square method (31) where each protein band was normalized to either a loading control (pan-actin or β-tubulin) or a protein band after staining the Hybond-P membranes with Coomassie Blue (Sigma).
Brain Tissue Collection and Extraction
Brain tissue from WT or BCATc−/− mice was freeze-clamped and stored at −80 °C, ground with mortar and pestle, and proteins were solubilized in the extraction buffer described above. The tissue extracts were sonicated, centrifuged at 13,200 × g for 15 min, and supernatants were collected. Protein was determined using a microplate BCA protein assay kit (Thermo Scientific).
CsA Treatments
T cells were activated with 3 μg/ml of plate-bound anti-CD3 and 2 μg/ml of soluble anti-CD28 (co-stimulation) and incubated with different concentrations of CsA (0, 0.05, 0.5, 1, or 5 μm) for 24 h. At the end of the treatment, T cells were washed twice with Krebs buffer and used to measure leucine oxidation and transamination as described above. Cell pellets were also extracted as described above and BCATc, BCATm, E1α, and E2 proteins were detected using Western blotting.
Amino Acid Analysis
Amino acid concentrations in brain tissue, mouse plasma, T cell pellets, and T cell medium were measured by HPLC; o-phthaldialdehyde amino acid derivatives were eluted by sodium acetate methanol gradient on a SupelcosilTM LC-18 column (15 cm × 4.6 mm, 3 μm) (Sigma) via a method described previously (32). Methanol extraction (methanol/wet weight, 20/1) was used for brain tissue. All other samples were deproteinized with 1.5 m perchloric acid (HClO4).
Measurements of Glucose Metabolism
Glucose metabolism was measured in either un-stimulated, TCR-stimulated, or co-stimulated T cells after 24 h of stimulation. All T cells were washed twice with DMEM (Sigma) and centrifuged at 900 × g for 10 min. The DMEM was formulated without glucose, l-Gln, phenol red, pyruvate, or NaHCO3; however, before the assay procedure, NaCl (143 mm, Fisher), l-Gln (2 mm, HyClone), and phenol red (0.5%, Sigma) were added to the DMEM and the pH adjusted to 7.35 ± 0.05. The T cells were seeded in poly-d-lysine-coated XF24-well microplates at 1 × 10⁶ cells per well in 100 μl of DMEM and incubated in a 37 °C incubator not supplemented with CO2 for 30 min. An additional 575 μl of DMEM was added after the cells had adhered and the cells were incubated for 30 min before placing them in the XF24 Extracellular Flux Analyzer (33) (Seahorse Bioscience, North Billerica, MA). After basal extracellular acidification rates (ECAR) were measured (non-glycolytic acidification), d-glucose (20 mm, Sigma), oligomycin (1.8 μm, Sigma), and 2-deoxy-d-glucose (80 mm, Sigma) were injected consecutively at ∼30-min intervals through reagent delivery chambers to determine basal glycolysis, maximum glycolytic capacity, and glycolytic reserve, respectively. Each measurement was repeated three times within the 30-min interval. ECAR values are expressed as mpH/min/mg of protein.
Rapamycin and NALA Treatments
T cells were activated with 3 μg/ml of plate-bound anti-CD3 and 2 μg/ml of soluble anti-CD28 (co-stimulation) and incubated concurrently with either 100 nm rapamycin or 20 mm NALA for 24 h. At the end of the treatment, T cells were washed twice with DMEM and used to measure glucose metabolism as described above. Cell pellets were also extracted as described above, and P-S6, S6, P-4EBP-1, and 4EBP-1 proteins were detected using Western blotting.
Statistical Analysis
Two tailed non-paired t test was used to assess the difference between different treatments or between BCATc−/− and WT mice. Values are mean ± S.E. or S.D., and p ≤ 0.05 was considered significantly different.
RESULTS
TCR Engagement Induces Expression of BCATc
Previously, we had performed transcriptional profiling on T cells in an effort to identify genes selectively induced by the TCR that might play a role in T cell anergy (28). These studies revealed the increased expression of the BCAT1 gene under conditions that promote T cell anergy. Notably, BCATc mRNA has also been shown to be up-regulated in CD4+ regulatory T cells (21). In an effort to better understand TCR-induced BCATc expression we examined microarray data for A.E7, under conditions upon TCR stimulation for 2, 4, and 6 h and after a 5-day rest (Fig. 1A). BCATc mRNA expression was induced significantly by 2 h and BCATc mRNA levels were still above the levels in un-stimulated cells after 5 days. To complement these studies, in vivo expression was analyzed in 6.5+ TCR transgenic T cells specific for hemagglutinin that were adoptively transferred into C3-HA mice, which expressed HA as a self-antigen (29). Initially, the cells are activated but by day 4 they are rendered anergic. On days 6 and 13 after transfer, BCATc mRNA expression was 2.5- and 3.5-fold higher than in naive cells (Fig. 1B). Therefore, the results demonstrate that BCATc mRNA expression is up-regulated by the TCR receptor in T cells in vivo.
FIGURE 1.
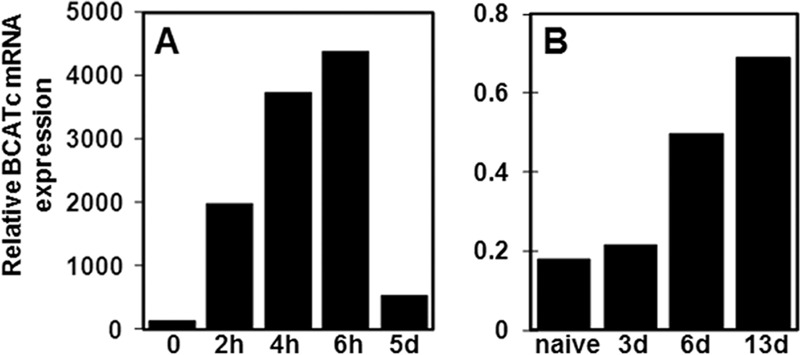
TCR activation induces expression of BCATc mRNA. A, CD4+ Th1 T cell clone, A.E7, stimulated with anti-CD3 for 2, 4, and 6 h or stimulated and then rested 5 days in fresh media. RNA was isolated and interrogated by Affymetrix gene chip u74 version 2. The data are depicted as relative expression for BCATc mRNA. B, 6.5+ TCR transgenic T cells specific for hemagglutinin were adoptively transferred into mice that express HA as a self-antigen (C3-HA), which leads to the induction of anergy as described in Ref. 29. The clonotypic cells were isolated and mRNA was interrogated by Affymetrix gene chip analysis for BCATc mRNA expression after 3, 6, and 13 days of transfer. The microarray data are consistent between two separate experiments and were confirmed by Western blotting as shown in Fig. 2A.
Because BCATc mRNA expression is detectable as early as 2 h after TCR stimulation, BCATc protein expression was examined starting at 2 h up to 24 h after TCR stimulation in the A.E7 T cell clone (Fig. 2A). BCATc protein induction was compared with the protein expression of the constitutively expressed BCATm isozyme and BCAT activity was measured at each time point (Fig. 2, A and B). As seen in Fig. 2A, BCATc protein increased within 2–4 h after TCR stimulation with a statistically significant increase observed at 8 h. BCATc protein levels were 20-fold higher than in un-stimulated T cells after 24 h of TCR stimulation in the absence or presence of anti-CD28 mediated co-stimulation. In contrast, BCATm protein expression was not significantly different from un-stimulated cells (Fig. 2A). Total BCAT activity (BCATm plus BCATc) increased following TCR stimulation reaching statistical significance at 8 h. Subtraction of BCATm activity (0 h), which represents the BCATm isozyme, from the total BCAT activity, revealed significantly higher BCATc activity at 8 h in agreement with the BCATc protein expression data (Fig. 2, A and B). These data demonstrate that BCATc protein expression is induced by TCR stimulation and results in increased BCAA transamination capacity in the cytosol of T cells. In un-stimulated cells transamination occurs solely in the mitochondria where the other BCAA degradative pathway enzymes such as BCKDC are located (7).
FIGURE 2.
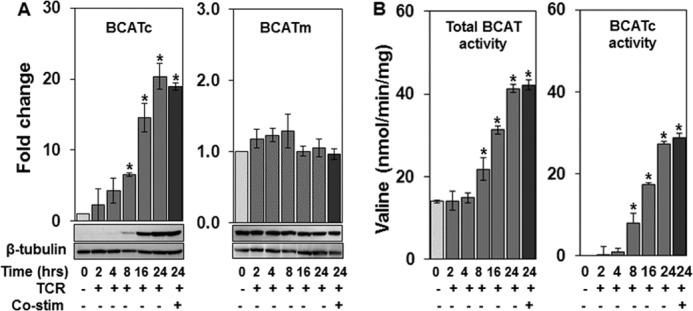
BCATc protein expression and enzyme activity are induced by TCR engagement. The CD4+ Th1 T cell clone, A.E7, was un-stimulated (0 h) or stimulated for 2, 4, 8, 16, and 24 h with anti-CD3 (TCR) or anti-CD3 plus anti-CD28 (co-stimulation, 24 h only). Cell extracts were used for Western blotting (A) or BCAT enzyme assay (B). A, Western blotting of BCATc or BCATm protein. β-Tubulin was used as a loading control and the data are expressed as a fold-change in protein expression relative to un-stimulated cells (0 h). Values are the mean ± S.E. of three experiments. B, total BCAT activity (BCATm plus BCATc) measured as described under “Experimental Procedures.” BCATc activity was estimated by subtracting BCAT activity at 0 h (BCATm activity) from total activity. Activity is expressed as nanomole of valine formed/min/mg of protein. Values are mean ± S.D. (n = 3) of a single representative experiment repeated three times; *, p ≤ 0.05 as compared with un-stimulated cells.
Deletion of BCAT1 Gene in T Cells from Global BCATc−/− Mice Does Not Affect the Expression of BCATm or BCKDC Proteins
To understand the biochemical and metabolic consequences of BCATc expression in T cells, a global BCATc−/− (knock-out) mouse was generated. Knock-out and heterozygote mice lacking Neo and Cre genes were identified by PCR genotyping (Fig. 3). Brain is one of a few tissues that express BCATc constitutively in adult rodents (8), therefore BCATc protein expression was examined in brain. BCATc was not detected in the brain of BCATc−/− mice, whereas heterozygotes had approximately half as much BCATc protein as WT mice. BCATm protein expression was not affected (Fig. 3). BCATc−/− mice grew at the same rate as their littermate WTs and their body and organ weights, plasma, and brain amino acids were the same as in WT animals.3
T cells from spleens and lymph nodes of WT and BCATc−/− mice were isolated and stimulated with anti-CD3 for 24 h. As shown in Fig. 3, TCR-stimulated T cells from the BCATc−/− mouse did not express BCATc. Having confirmed the loss of BCATc expression in the BCATc−/− mouse T cells, the effect of BCATc deletion on protein expression of BCAA catabolic enzymes was examined (Fig. 4). BCATc, BCATm, and BCKDC (E1 and E2) proteins were compared in un-stimulated, TCR-stimulated, and co-stimulated T cells from WT and BCATc−/− mice. BCATc protein was expressed in TCR-stimulated and co-stimulated WT cells, whereas BCATm protein levels were not statistically different in WT or BCATc−/− cells (Fig. 4, BCATc and BCATm panels). TCR engagement and co-stimulation did influence expression of the BCKDC enzyme E1 (E1α subunit) but not E2 (Fig. 4, E1α and E2 panels). The concentration of the BCKDC E1 enzyme decreased 75 and 50% upon TCR stimulation and co-stimulation in WT and BCATc−/− cells, respectively. However, the phosphorylation state of E1 was low and did not change.3 Therefore, the results suggest that TCR receptor signaling controls expression of BCATc and influences E1 expression, whereas BCATm and E2 proteins are not changed significantly by TCR or influenced by loss of BCATc in T cells.
FIGURE 4.
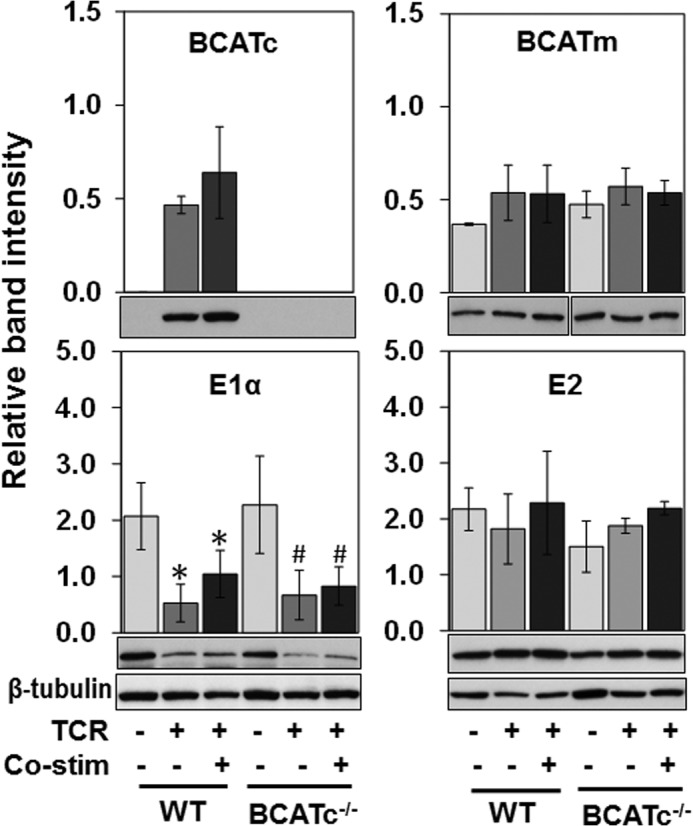
Loss of BCATc does not change the effect of TCR engagement on BCATm and BCKDC enzymes. T cells from WT and BCATc−/− mice were isolated as described in the legend to Fig. 3 and left either un-stimulated or activated with anti-CD3 (TCR) and anti-CD3/CD28 (co-stimulation) for 24 h. BCATc, BCATm, and BCKDC (E1α subunit and E2 enzyme) were determined by Western blotting of cell extracts. β-Tubulin was used as a loading control. Values are mean ± S.D. (n = 3) of a single representative experiment repeated three times. For E1α, *, p ≤ 0.05 as compared with un-stimulated WT cells; #, p ≤ 0.05 as compared with un-stimulated BCATc−/− cells.
Leu Metabolism Is Increased by TCR Engagement Whereas Deletion of the BCATc Gene Reduces Leu Transamination in T Cells
The induction of BCATc expression in TCR-stimulated T cells from WT animals raised the possibility that BCAA transamination would increase and therefore increase BCAA oxidation. On the other hand, the decrease in E1 enzyme, which catalyzes irreversible decarboxylation of BCKAs, may reduce BCKDC capacity sufficiently to decrease BCAA oxidation, even though the supply of α-keto acids for BCKDC increases. To determine whether changes in the enzyme concentrations affected Leu metabolism, WT cells were TCR activated in the absence and presence of co-stimulation for 24 h; and Leu transamination and oxidation were determined. Oxidation was measured as 14CO2 release from [1-14C]Leu, and total transamination is the sum of oxidation and [14C]KIC formation. As seen in Fig. 5A, the primary product of Leu metabolism in WT cells was KIC, whereas Leu oxidation was low even in un-stimulated WT cells (14% of total Leu metabolism). There was a 3-fold increase in KIC formation and 2.6-fold increase in total transamination in both TCR-stimulated and co-stimulated WT cells compared with un-stimulated WT cells (Fig. 5A, WT panel). To determine whether the increased KIC in WT cells accumulated in, or was released by the cells, KIC concentrations were measured in cell suspensions, cell media, and cell pellets of WT cells (Fig. 5B). The results showed that the majority of KIC produced from Leu transamination was released into the cell media.
FIGURE 5.

KIC is the primary product of leucine metabolism in T cells. T cells from WT and BCATc−/− mice were isolated as described in the legend to Fig. 3 and either left un-stimulated or activated with anti-CD3 (TCR) or anti-CD3 and anti-CD28 (co-stimulation) for 24 h. A, leucine oxidation and KIC production were measured using the radioactive assay described under “Experimental Procedures.” *, p ≤ 0.05 as compared with un-stimulated WT cells; #, p ≤ 0.05 as compared with un-stimulated BCATc−/− cells. B, KIC was measured in whole cell suspensions, cell media, or cell pellets from WT T cells. In A and B, values are mean ± S.D. (n = 3) of a single representative experiment repeated three times.
Loss of BCATc expression in BCATc−/− cells resulted in less Leu transamination as seen by reduced KIC production in stimulated cells, whereas Leu oxidation was similar to WT cells (Fig. 5A, BCATc−/− panel). Although, KIC formation in TCR-stimulated or co-stimulated BCATc−/− cells was less than in WT cells, it did not reduce KIC accumulation to levels found in un-stimulated cells, implying that rates of BCATm catalyzed Leu transamination are influenced by TCR engagement in the absence of BCATc. Leu oxidation, on the other hand, was highest in un-stimulated WT or BCATc−/− cells, and it decreased with TCR stimulation or co-stimulation, which is consistent with the decline in E1 enzyme (Figs. 4 and 5A). Thus, the data demonstrate that increased BCATc expression in WT cells leads to increased Leu transamination and suggests that upon TCR engagement, there is significant cytosolic and mitochondrial production of KIC, whereas in un-stimulated cells, KIC is produced in the mitochondria. Under all conditions, oxidation of Leu in T cells is limited at the BCKDC step and BCKAs are released from the cells.
NFAT Signaling Regulates BCATc Expression and Impacts Leu Metabolism in WT T Cells
Having observed the robust up-regulation of BCATc expression upon antigen recognition, we wanted to determine the molecular mechanism of TCR-induced BCATc. The BCATc promoter region has a putative phylogenetically conserved NFAT binding site (TGGAAA) (34), and our microarray strategy suggested that NFAT signaling may regulate BCATc expression (28). The effect of NFAT was tested by using cyclosporin A (CsA), an immunosuppressant compound that inhibits NFAT by targeting calcineurin (35). T cells were activated with anti-CD3 and anti-CD28 and treated simultaneously with increasing concentrations of CsA for 24 h, and the effect on BCAA catabolic enzymes and Leu metabolism was determined (Fig. 6, A–E). BCATc protein expression was inhibited by as low as 0.05 μm CsA (40% decrease), whereas a 90% inhibition of BCATc protein expression was observed at CsA concentrations of 0.5 μm or higher (Fig. 6A). Surprisingly, concentrations of CsA above 0.05 μm resulted in a significant increase (60% at 1 μm CsA) in BCATm protein concentration (Fig. 6B). BCKDC enzyme E1 (E1α subunit) was 60% higher at 0.5 μm CsA, whereas E2 protein concentration was reduced by 40% at the higher CsA concentrations (Fig. 6, C and D).
FIGURE 6.

NFAT signaling regulates BCATc expression and leucine metabolism in T cells. WT cells were isolated as described in the legend to Fig. 3, activated with anti-CD3 and anti-CD28 (co-stimulation), and incubated subsequently with 0, 0.05, 0.5, 1, or 5 μm CsA for 24 h. BCATc (A), BCATm (B), and BCKDC (E1α subunit and E2 enzyme, C and D, respectively) proteins were determined by Western blotting. β-Tubulin was used as a loading control. Data are expressed as a fold-change in protein expression as compared with untreated cells. E, leucine oxidation (black bars) and KIC production (light gray bars) measured as described under “Experimental Procedures.” Data are expressed as nanomole of 14CO2 released (leucine oxidation) or [1-14C]KIC formed/mg of protein. In A–E, values are the mean ± S.D. (n = 3) of a single representative experiment repeated four times, *, p ≤ 0.005 as compared with untreated cells.
Next, the effect of CsA treatment on Leu metabolism was determined. KIC formation was not altered by 0.05 μm CsA but was inhibited 40% at CsA concentrations ≥0.5 μm. Leu oxidation was low and was not inhibited by addition of CsA, regardless of the observed fluctuations in levels of E1 and E2. The data support the hypothesis that calcineurin-NFAT signaling regulates BCATc protein expression. NFAT was also found to exert a modest influence on expression of BCATm and BCKDC enzymes, which likely partially compensates for the loss of BCATc; but BCKDC activity still limits Leu oxidation in T cells.
Loss of BCATc Expression Promotes mTORC1 Activation in BCATc−/− T Cells
The mTOR pathway provides a vital link between the immune function and metabolism and plays a critical role in T cell activation and lineage commitment (20). Leu is a known activator of mTORC1 and promotes T cell activation (23). To determine whether the loss of cytosolic Leu transamination due to BCATc deletion from T cells impacted Leu stimulation of mTORC1 complex, the phosphorylation state of two downstream substrates of the mTORC1 complex, S6 and 4EBP-1, were examined in T cells from WT and BCATc−/− mice (Fig. 7, A and B). As seen in Fig. 7, phosphorylation of S6 (Ser240/244) and 4EBP-1 (Thr37/46) was not detectable in un-stimulated WT or BCATc−/− cells. Upon TCR stimulation, T cells from WT mice exhibited low levels of phosphorylation of S6 and 4EBP-1, consistent with the role of co-stimulation in markedly enhancing TCR-induced mTOR activation (23). In TCR-stimulated T cells isolated from BCATc−/− mice, S6 and 4EBP-1 exhibited 4- and 6-fold higher levels of phosphorylation when compared with WT T cells (Fig. 7). Moreover, 4EBP-1 exhibited significantly higher phosphorylation (3.7-fold) in BCATc−/− cells in the presence of the co-stimulatory signal (S6 phosphorylation was 40% higher, but did not reach statistical significance) (Fig. 7). The results suggest that cytosolic transamination of Leu modulates mTORC1 signaling either through changes in Leu concentration or its α-keto acid KIC.
FIGURE 7.
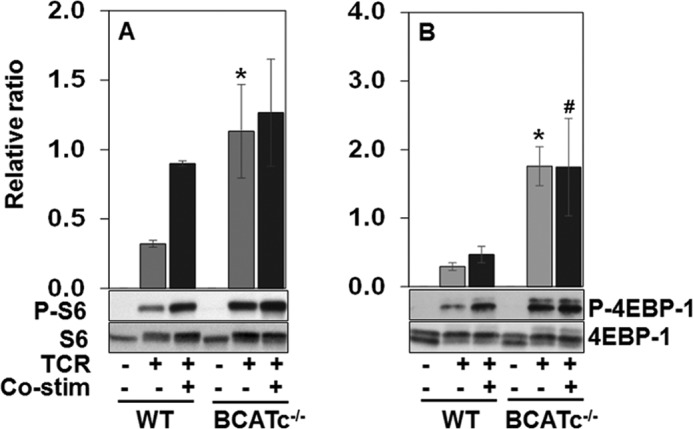
Loss of BCATc expression up-regulates mTORC1 substrates in T cells. T cells from WT and BCATc−/− mice were isolated as described in the legend to Fig. 3 and were either left un-stimulated or activated with anti-CD3 (TCR) and anti-CD3/anti-CD28 (co-stimulation) for 24 h. P-S6, S6 (A), P-4EBP-1 and 4EBP-1 (B) proteins in these cells were determined by Western blotting. Each graph shows the ratio between the phosphorylated and total forms of S6 and 4EBP-1, respectively. Values are the mean ± S.D. (n = 3) of a single representative experiment repeated three times; *, p ≤ 0.05 as compared with TCR stimulated WT cells (light gray bars); #, p ≤ 0.05 as compared with co-stimulated WT cells (dark gray bars).
BCATc−/− T Cells Accumulate BCAAs upon Stimulation
BCATc may modulate mTORC1 activity in T cells by affecting cytosolic Leu availability for mTORC1 activation. To explore whether Leu and the other BCAA concentrations are changed when BCATc is up-regulated, BCAA concentrations in cells and media from WT and BCATc−/− cells were compared after 24 h of stimulation (see Tables 1 and 2).
TABLE 1.
Amino acid concentrations in cell pellets from un-stimulated, TCR-stimulated, or co-stimulated CD4+ T cells from WT and BCATc−/− mice
Amino acid concentrations are nmol/g wet weight. The experiment was repeated three times, values are the mean ± S.D. of a single representative experiment.
| Un-stimulated |
TCR stimulated |
Co-stimulated |
||||
|---|---|---|---|---|---|---|
| WT | BCATc−/− | WT | BCATc−/− | WT | BCATc−/− | |
| Leu | 66 ± 1 | 60 ± 1a | 45 ± 4a | 59 ± 3b,c | 58 ± 6a | 74 ± 6b,d |
| Ile | 61 ± 1 | 57 ± 1a | 44 ± 5a | 60 ± 1b,c | 60 ± 5 | 77 ± 7b,d |
| Val | 58 ± 2 | 56 ± 2 | 24 ± 2a | 33 ± 4b,c | 30 ± 2a | 37 ± 3b,d |
| His | NDe | ND | ND | ND | ND | ND |
| Met | 18 ± 2 | 16 ± 1 | 8 ± 0a | 10 ± 1b,c | 10 ± 0a | 11 ± 51b |
| Phe | 21 ± 0 | 19 ± 1 | 12 ± 0a | 15 ± 0b,c | 15 ± 1a | 18 ± 2 |
| Trp | 6 ± 0 | 7 ± 1 | 5 ± 0a | 5 ± 0b | 5 ± 0a | 5 ± 0b |
| Thr | 149 ± 2 | 141 ± 1a | 46 ± 4a | 53 ± 2b,c | 60 ± 1a | 58 ± 5b |
| Lys | 95 ± 4 | 98 ± 2 | 63 ± 12a | 68 ± 3b | 59 ± 12a | 73 ± 8b |
| BCAAs | 184 ± 1 | 174 ± 5a | 115 ± 6a | 152 ± 4b,c | 149 ± 11a | 190 ± 15d |
| Essential amino acids | 473 ± 7 | 454 ± 10a | 249 ± 17a | 302 ± 10b,c | 299 ± 27a | 355 ± 28b |
| Glu | 3712 ± 59 | 3712 ± 53 | 1657 ± 116a | 1881 ± 28b,c | 2120 ± 238a | 2250 ± 297b |
| Gln | 1903 ± 18 | 1742 ± 51a | 570 ± 31a | 599 ± 25b | 630 ± 8a | 601 ± 69b |
| Asp | 3284 ± 78 | 3058 ± 62a | 251 ± 22a | 336 ± 16b,c | 297 ± 6a | 291 ± 45b |
| Asn | 278 ± 5 | 259 ± 4a | 155 ± 11a | 161 ± 7b | 191 ± 22a | 184 ± 22b |
| Ala | 237 ± 3 | 231 ± 5 | 151 ± 8a | 170 ± 10b | 213 ± 3a | 203 ± 17b |
| Gly | 1758 ± 22 | 1742 ± 32 | 334 ± 3a | 315 ± 9b | 449 ± 4a | 405 ± 7b,d |
| Ser | 141 ± 3 | 116 ± 3a | 87 ± 5a | 83 ± 5b | 78 ± 4a | 65 ± 3b,d |
| Tyr | 50 ± 1 | 48 ± 3 | 60 ± 1a | 56 ± 3b | 63 ± 4a | 56 ± 4 |
| Arg | 171 ± 3 | 155 ± 3 | 117 ± 8a | 145 ± 5b,c | 153 ± 1a | 170 ± 13b,d |
| Non-essential amino acids | 11534 ± 165 | 11064 ± 267 | 3383 ± 50a | 3747 ± 128b,c | 4193 ± 233a | 4225 ± 569b |
| Tau | 9689 ± 178 | 9195 ± 304 | 1249 ± 39a | 1231 ± 31b | 1774 ± 12a | 1682 ± 36b,d |
| Orn | 43 ± 0 | 46 ± 2a | 29 ± 2a | 15 ± 1b,c | 34 ± 2a | 14 ± 2b,d |
| B-Ala | 122 ± 3 | 137 ± 2a | 38 ± 1a | 33 ± 1b,c | 65 ± 2a | 56 ± 1b,d |
a p ≤ 0.05 as compared to un-stimulated WT.
b p ≤ 0.05 as compared to un-stimulated WT or BCATc−/− T cells.
c p ≤ as compared to TCR-stimulated WT cells.
d p ≤ 0.05 as compared to co-stimulated WT cells.
e ND, not detectable.
TABLE 2.
Amino acid concentrations in T cell media at 0 h or in cell media from un-stimulated, TCR-stimulated, or co-stimulated CD4+ T cells from WT or BCATc−/− mice after 24 h of stimulation
Amino acid concentrations are in μm. The experiment was repeated three times, values are the mean ± S.D. of a single representative experiment.
| 0 h, no cells, T cell media | 24 h |
||||||
|---|---|---|---|---|---|---|---|
| Un-stimulated |
TCR-stimulated |
Co-stimulated |
|||||
| WT | BCATc−/− | WT | BCATc−/− | WT | BCATc−/− | ||
| Leu | 292 ± 3 | 278 ± 14 | 296 ± 24 | 236 ± 9a,b | 250 ± 4a,c | 229 ± 26a,b | 259 ± 7a,c |
| Ile | 287 ± 4 | 269 ± 11 | 286 ± 30 | 240 ± 11a | 257 ± 4a | 246 ± 31 | 284 ± 7 |
| Val | 152 ± 4 | 146 ± 13 | 157 ± 16 | 116 ± 5a,b | 120 ± 5a,c | 105 ± 13a,b | 120 ± 5a,c |
| His | NDd | ND | ND | ND | ND | ND | ND |
| Met | 63 ± 1 | 63 ± 4 | 66 ± 7 | 50 ± 3a,b | 51 ± 2a,c | 45 ± 5a,b | 50 ± 2a,c |
| Phe | 77 ± 2 | 76 ± 5 | 78 ± 6 | 56 ± 3a,b | 61 ± 4a,c | 50 ± 3a,b | 54 ± 1a,c |
| Trp | 20 ± 1 | 23 ± 0a | 23 ± 1a | 18 ± 0a,b | 16 ± 1a,c | 14 ± 1a,b | 15 ± 0a,c |
| Thr | 129 ± 4 | 128 ± 15 | 137 ± 18 | 103 ± 5a | 109 ± 4a | 97 ± 16a | 113 ± 6a |
| Lys | 182 ± 1 | 159 ± 7a | 177 ± 13 | 134 ± 6a,b | 144 ± 7a,c | 115 ± 26a,b | 143 ± 6a,c |
| BCAAs | 732 ± 10 | 685 ± 40 | 739 ± 70 | 600 ± 25a,b | 625 ± 13a,c | 580 ± 69a | 658 ± 20a |
| Essential amino acids | 1206 ± 15 | 1134 ± 58 | 1219 ± 116 | 965 ± 41a,b | 1007 ± 29a,c | 902 ± 119a,b | 1030 ± 34a,c |
| Glu | 170 ± 7 | 269 ± 24a | 278 ± 31a | 504 ± 22a,b | 502 ± 7a,c | 516 ± 83a,b | 613 ± 21ac |
| Gln | 2751 ± 56 | 2250 ± 153a | 2470 ± 244a | 2023 ± 72a | 1995 ± 45a,b | 1938 ± 279a | 2261 ± 77a |
| Asp | 124 ± 5 | 124 ± 14 | 130 ± 14 | 153 ± 5a,b | 152 ± 5a,c | 162 ± 25a | 183 ± 6a |
| Asn | 262 ± 8 | 238 ± 23 | 262 ± 27 | 236 ± 9a | 234 ± 4a | 226 ± 36 | 276 ± 11 |
| Ala | 66 ± 3 | 95 ± 11a | 93 ± 9a | 75 ± 1a,b | 78 ± 5a,c | 66 ± 8b | 81 ± 3a |
| Gly | 118 ± 7 | 205 ± 13a | 196 ± 35a | 155 ± 9a,b | 151 ± 9a | 152 ± 26a,b | 149 ± 6a |
| Ser | 165 ± 9 | 155 ± 21 | 140 ± 14a | 136 ± 7a | 127 ± 17a | 102 ± 14a,b | 115 ± 8a,c |
| Tyr | 86 ± 1 | 80 ± 6 | 87 ± 8 | 68 ± 3a,b | 73 ± 2a,c | 65 ± 9a | 75 ± 3a,c |
| Arg | 650 ± 11 | 578 ± 35a | 626 ± 62 | 557 ± 29a | 591 ± 9a | 592 ± 75 | 665 ± 26 |
| Non-essential amino acids | 4392 ± 80 | 3993 ± 297 | 4282 ± 435 | 3968 ± 161a | 3927 ± 80a | 3885 ± 533 | 4384 ± 166 |
| Tau | 4 ± 1 | 4 ± 1 | 3 ± 1 | 11 ± 0a,b | 11 ± 1a,c | 13 ± 1a,b | 13 ± 0a,c |
| Orn | 40 ± 3 | 63 ± 8a | 69 ± 7a | 62 ± 3a | 68 ± 15a | 53 ± 10 | 63 ± 2a |
| B-Ala | ND | ND | ND | ND | ND | ND | ND |
a p ≤ 0.05 as compared to 0 h T cell media,
b p ≤ 0.05 as compared to media from un-stimulated WT cells.
c p ≤ 0.05 as compared to media from BCATc−/− cells.
d ND, not detectable.
In cell pellets from un-stimulated WT cells, the concentrations of total BCAAs were significantly higher by 60 and 20% as compared with TCR-activated WT cells in the absence or presence of co-stimulation, respectively (Table 1). TCR activation in BCATc−/− cells showed a similar impact on BCAA concentrations with Leu, Ile, and Val being significantly higher by 30, 40, and 40%, respectively, compared with TCR-stimulated WT cells (Table 1).
The remaining essential amino acids as well as total non-essential amino acids were significantly lower upon activation in WT cells. The biggest change was observed for Thr, Gln, Asp, Gly, and Tau as they were 60, 70, 90, 70, and 80% lower upon co-stimulation in WT cells as compared with un-stimulated WT cells, respectively (Table 1). These results are consistent with other reports (36) showing that during T cell activation, the T cells enhance utilization of amino acids to meet their increased metabolic, energy, and protein synthesis demands. The decrease in cellular Tau concentration lowered intracellular Tau from ∼9 to 1–2 μmol/g wet weight with the lowest Tau concentrations found in TCR-stimulated cells. The data show that loss of BCATc expression (BCATc−/− mice) results in higher cellular concentrations of BCAAs in TCR-activated BCATc−/− cells in the absence or presence of co-stimulation when compared with the corresponding WT cells. This correlates with higher levels of mTORC1 signaling, suggesting a link between BCAA metabolism and mTORC1 activation in the development of T cell immune response.
Amino acid concentrations in T cell media were measured to determine the impact of cell metabolism on media amino acid concentrations (Table 2). There was a significant net uptake of BCAAs and the remaining essential amino acids after 24 h of TCR activation in the absence or presence of co-stimulation, regardless of the genotype as compared with un-stimulated T cell media or 0 h of stimulation. The sum of non-essential amino acids did not change upon stimulation, however, individual amino acids did change significantly. Based on changes in media concentrations, there was significant uptake of Ser and Gln with release of Glu, Asp, and Gly when compared with the same amino acids in 0 h T cell media. Glu, which is synthesized from Gln by glutaminase, accumulated in the cell media, increasing the media concentration around 3-fold upon stimulation and with an approximately 60% increase in un-stimulated cells. Net Gln uptake was observed under all conditions with approximately 30% decrease in the media from stimulated WT cells (Table 2). The results show that T cells increase essential amino acid uptake to meet their metabolic and protein synthesis needs and, as reported by others (37, 38) suggest that T cells metabolize Gln to supply energy and support anapleurosis and nucleotide biosynthesis. Loss of BCATc expression does not appear to significantly change the pattern of amino acid uptake or release.
BCATc−/− T Cells Have Up-regulated Glycolytic Metabolism
The highly energetic process of T cell activation induces a shift to glycolytic metabolism to support rapid cell growth and generation of effector T cells (36, 39). We next tested whether loss of BCATc expression in stimulated T cells influences glycolytic function. Resting and stimulated T cells from WT and BCATc−/− cells were cultured in glucose-free media and ECAR was measured before and after addition of glucose, followed by oligomycin to inhibit mitochondrial ATP synthesis (oxidative ATP synthesis) and 2-deoxy-d-glucose to inhibit glycolysis (Fig. 8, A–D). ECAR provides a means to measure lactate production indirectly by measuring changes in pH associated with lactate release into the media (33, 40). Non-glycolytic acidification was low and similar in WT and BCATc−/− cells (Fig. 8, A–D). Addition of glucose to the medium stimulated glycolysis, resulting in a rapid increase in ECAR even in un-stimulated T cells, with no differences observed between WT and BCATc−/− cells (Fig. 8A). In contrast, TCR stimulation in the absence and presence of co-stimulation of BCATc−/− cells showed higher increases in ECAR, when glucose was added, compared with the corresponding WT cells (Fig. 8, B and C). When results from all three measurement points were averaged, activated BCATc−/− cells exhibited 1.8- and 2.0-fold higher rates of glycolysis in the absence and presence of co-stimulation compared with WT cells (Fig. 8E). Addition of oligomycin, to block oxidative ATP synthesis, results in a subsequent increase in ECAR, revealing the maximum glycolytic capacity of the T cells (see scheme in Fig. 8D). TCR stimulation of BCATc−/− cells in the absence and presence of co-stimulation showed 3.6- and 2.1-fold higher maximum glycolytic capacity as compared with TCR and co-stimulated WT cells, respectively (Fig. 8, B, C, and F). Last, addition of 2-deoxy-d-glucose to block glycolysis decreased ECAR back to basal rates in all conditions (Fig. 8, A–C). The difference between glycolytic capacity and glycolysis defines glycolytic reserve (Fig. 8, D and G). As seen in Fig. 8G, TCR stimulation of BCATc−/− cells in the absence and presence of co-stimulation led to a 6.2- and 3.7-fold higher glycolytic reserve compared with the corresponding WT cells. The observed changes in glycolytic metabolism in TCR-activated BCATc−/− cells were not related to differences in Glut1 protein expression (Fig. 8H), suggesting that enhanced glycolysis in BCATc−/− cells is not dependent on nutrient transporter expression. However, loss of BCATc in activated T cells resulted in higher cellular Leu concentrations (Table 1) and these cells exhibited up-regulation of mTORC1 activity (Fig. 7, A and B). It has been shown that mTOR plays an important role in up-regulating glycolytic metabolism (41, 42). To test whether mTORC1 and/or Leu are responsible for the increased glycolytic function in T cells upon activation, T cells were activated with anti-CD3 and anti-CD28 and treated with either the mTORC1 inhibitor rapamycin (43) or the Leu structural analog NALA (44) for 24 h (Fig. 9). Basal glucose-stimulated glycolysis was not affected by rapamycin or NALA treatment of T cells (Fig. 9, A and B). However, addition of oligomycin to rapamycin and NALA-treated T cells revealed that these cells did not show increased maximum glycolytic capacity and thus did not exhibit any glycolytic reserve (Fig. 9, A and B). Consistent with mTORC1 inhibition, both rapamycin and NALA treatment inhibited the phosphorylation of S6 and 4EBP-1 (23, 45, 46) (Fig. 9C). In summary, deletion of the BCAT1 gene in activated T cells results in higher cellular Leu levels, mTORC1 activation, and increased glycolysis, glycolytic capacity, and glycolytic reserve. Although mTORC1 and Leu appear important for the ability of T cells to reach maximum glycolytic capacity and maintain glycolytic reserve, they did not change the basal glycolytic rate implying that there might be an additional non-mTORC1-mediated mechanism whereby the presence of BCATc affects basal glycolysis in activated T cells.
FIGURE 8.

Loss of BCATc expression up-regulates glycolytic metabolism in T cells. T cells from WT and BCATc−/− mice were isolated as described in the legend to Fig. 3 and activated with either anti-CD3 (TCR) or anti-CD3/anti-CD28 (co-stimulation) for 24 h. A–C, un-stimulated (A), TCR-stimulated (B), and co-stimulated (C) T cells were cultured in glucose-free media and their metabolic profile was determined by a Seahorse XF24 analyzer measuring ECAR following treatment with glucose (Glc), oligomycin (Oligo), and 2-deoxy-d-glucose(2-DG). D, diagram of XF glycolysis test profile as shown on Seahorse biosciences website. E, glycolysis, calculated by subtracting the non-glycolytic ECAR from the glucose-induced ECAR. F, maximum glycolytic capacity, calculated by subtracting the non-glycolytic ECAR from the oligomycin-induced ECAR. G, glycolytic reserve, calculated by subtracting the glucose-induced ECAR from the oligomycin-induced ECAR. H, Glut1 protein determined by Western blotting. Pan-actin used as a loading control. All values are the mean ± S.D. of a single representative experiment repeated three times; *, p ≤ 0.05 as compared with TCR-stimulated WT cells (E–G); #, p ≤ 0.05 as compared with co-stimulated WT cells (E–G); **, p ≤ 0.05 as compared with un-stimulated WT cells (H); ***p ≤ 0.05 as compared with un-stimulated BCATc−/− cells (H).
FIGURE 9.

Rapamycin and NALA affect the glycolytic capacity and reserve of activated T cells. WT cells were isolated as described in the legend to Fig. 3, activated with anti-CD3/anti-CD28 (co-stimulation), and incubated subsequently with 100 nm rapamycin or 20 mm NALA for 24 h. A and B, T cell metabolic profile was determined by a Seahorse XF24 analyzer measuring ECAR as described in the legend to Fig. 8. C, P-S6, S6, P-4EBP-1, and 4EBP-1 proteins were determined by Western blotting. β-Tubulin was used as a loading control. All values are the mean ± S.D. of a single representative experiment repeated three times; *, p ≤ 0.05 as compared with untreated cells.
DISCUSSION
Amino acids are essential for the increased protein synthesis and regulation of the immune response and their deficiency impairs immune function, increasing susceptibility to infectious diseases (47, 48). In recent years, great advances have been made in understanding the role of amino acid metabolism of Arg and Trp during development of the immune response (49–51). Hence, amino acid catabolic enzymes arginase and indoleamine 2,3-dioxygenase have been shown to have important immunoregulatory functions (52, 53). BCATc is another amino acid catabolic enzyme that is described here as a novel immunoregulatory enzyme and indicates a role for Leu metabolism in the regulation of T cell metabolic reprograming.
BCATc mRNA expression was triggered by the TCR of CD4+ T cells and resulted in over 20-fold elevation in BCATc protein concentration at 24 h of stimulation in the absence or presence of a co-stimulatory signal. TCR-induced expression of BCATc protein was under the control of NFAT signaling as the NFAT inhibitor, CsA, inhibited BCATc protein expression. Transcription factors of the NFAT family play a pivotal role in transcription of cytokine genes and other genes critical for the immune response (54). The robust up-regulation of BCATc by this transcription factor critical for T cell activation suggests that NFAT serves to not only regulate effector function but also metabolic programs necessary to support/regulate that function. Interestingly, the BCAT1 gene has been shown to be a direct target for c-myc activation (55). Recently, c-myc has been shown to play a vital role in CD8+ T cell effector function (22). In these studies, c-myc was shown to up-regulate the glycolytic machinery necessary for T cell activation (22). The fact that BCATc−/− T cells demonstrate enhanced glycolysis suggests that up-regulation of BCATc represents a negative feedback loop in this pathway.
BCATc catalyzes the cytosolic transamination of Leu, Ile, and Val, whereas BCATm catalyzes the same reaction in the mitochondria (4, 5, 56). The second step or the irreversible oxidative decarboxylation of BCKAs, catalyzed by BCKDC, commits the BCAA carbon skeleton to the degradative pathway (57). In un-stimulated T cells, BCATc was not expressed and therefore all BCAA metabolism occurred in the mitochondria. Measurement of Leu catabolism showed that regardless of the metabolic state in T cells, the primary product of BCAA metabolism is BCKA with only 14% committed to irreversible oxidation. Upon stimulation, T cells expressed a high ratio of transaminase to oxidative capacity with an actual decrease of oxidative capacity resulting from the reduced expression of the E1 dehydrogenase of BCKDC (see Fig. 4). In rodents, skeletal muscle is one of the organs with high aminotransferase to oxidative capacity ratio and absence of BCAT in the rodent liver supports extensive inter organ cooperation in the catabolism of BCAA and their metabolites (57). It is possible that a similar regulatory system evolved in the immune system where BCAA metabolites can shuttle between immune and target cells. The BCKDC catalyzes the same set of reactions as the pyruvate dehydrogenase complex reaction with the BCKA rather than pyruvate as substrates and NADH as a product (58). During T cell activation, T cells undergo metabolic reprograming, switching to aerobic glycolysis to support macromolecular synthesis while secreting lactate (59, 60). Oxidative decarboxylation of pyruvate in activated T cells decreases and lactate formation regenerates the NAD+ necessary for continuous glycolysis (60). Similar to pyruvate, oxidative (mitochondrial) BCAA catabolism declines, whereas BCAA transamination triggered by BCATc increases in activated T cells.
T cell activation increases the demand for amino acids to support the increased rate of protein synthesis (61, 62), as seen in studies on amino acid deprivation and the immune response (21, 38). However, the actual changes in intracellular and intercellular amino acid concentrations upon T cell stimulation have not been explored before. In this study, intracellular and media amino acid analysis showed that activated WT cells utilized more essential amino acids (including BCAAs) and non-essential amino acids than un-stimulated WT cells. There was significant uptake of Gln from the media, which increased upon activation; however, there was a significant release of Glu by the cells. Intracellular concentrations of Gln and Glu both decreased upon stimulation and are likely used during glutaminolysis that increases upon T cell activation (63). The most dramatic change in amino acid concentrations in stimulated T cells was the 80–90% decrease in intracellular Tau. Tau is important for T cell volume regulation and mice lacking the Tau receptor have defects in T cell survival and T cell memory development (64). Other non-essential amino acids that changed significantly included Ser and Gly. Ser biosynthesis by phosphogycerate dehydrogenase is important for cancer cell proliferation (65), and may play a similar role in proliferating T cells, whereas Gly is an anti-inflammatory and immunomodulatory nutrient (47). Therefore, amino acids are not only essential for the increased protein synthesis in activated T cells but also play a role in the regulation of immune function.
As shown in BCATc−/− T cells, cellular Leu levels were higher than in WT cells upon activation. Leu has been shown to regulate mTOR signaling through activation of the mTORC1 pathway and downstream targets, S6 kinase and 4EBP-1 (16). Leu stimulates mTORC1 via leucyl-tRNA synthetase, an intracellular Leu sensor that interacts with Rag GTPase to activate mTORC1 (66). Leu availability is essential for mTORC1 activity in activated T cells (22, 23, 67). Sinclair et al. (22) showed that Slc7a5 is the main large neutral amino acid transporter controlling Leu uptake by T cells and loss of Slc7a5 prevents Leu uptake and inhibits mTORC1 activity in T cells. Our results with BCATc−/− and WT cells, showing higher Leu concentrations in the BCATc−/− cells, suggest that BCATc serves as a regulatory checkpoint for Leu availability during T cell activation. Thus, BCATc−/− T cells demonstrated increased mTORC1 activity as measured by the increased phosphorylation state of S6 and 4EBP-1. This effect was more pronounced in the absence of co-stimulation when mTOR activation is lower than in fully activated T cells. To this end, the fact that we initially observed increased BCATc expression in “anergic” T cells (Fig. 1), and that BCATc is highly expressed in Treg cells (21), suggests that BCATc may contribute to T cell anergy in part by restraining mTOR activity. Indeed, anergic T cells fail to up-regulate their metabolic machinery (23) and BCATc may serve as a negative regulatory checkpoint for glycolysis. Likewise, it has been shown that mTORC1 activation and the up-regulation of glycolytic machinery is important for Th1 and Th17 differentiation (67). Our data suggest that BCATc (and perhaps Leu depletion) might play a role in restraining effector differentiation.
Taken together our data establish BCATc as a potential modulator of mTORC1 signaling and TCR-induced glycolytic metabolism during T cell activation. TCR-induced BCATc expression via NFAT signaling results in increased Leu transamination but lower Leu oxidation. Deletion of BCATc results in accumulation of Leu and up-regulation of mTORC1 signaling, and glycolysis. Under conditions of full activation, BCATc may serve as part of a negative feedback loop. Alternatively, in the absence of adequate Leu or under suboptimal activation conditions, BCATc may serve to inhibit differentiation and promote tolerance.
Acknowledgments
We thank Angela Alme for growing the A.E7 Th1 clone, Dr. Marzieh Taghavi and Janet Rinehart for assistance with plasma and brain amino acid measurements, Dr. Madlyn Frisard for assistance with the XF24 Seahorse analyzer, Dr. Adele Addington for assistance in mouse breeding and critical evaluation of the manuscript, and Seahorse Biosciences for permission to use the diagram of XF glycolysis profile in Fig. 8.
This work was supported, in whole or in part, by National Institutes of Health Grants DK34738 (to S. M. H.) and R01CA098109 (to J. D. P.) and a grant from Virginia Tech (to S. M. H.).
E. A. Ananieva and S. M. Hutson, unpublished data.
- BCAAs
- branched chain amino acids
- BCKAs
- branched chain keto acids
- BCATc/BCATm
- cytosolic/mitochondrial branched chain aminotransferase
- BCKDC
- branched chain α-keto acid dehydrogenase enzyme complex
- KIC
- α-ketoisocaproate
- CsA
- cyclosporin A
- TCR
- T cell receptor
- BCATc−/− mice
- global BCATc knockout mice
- mTOR
- mammalian target of rapamycin complex
- NALA
- N-acetyl-leucine amide
- ECAR
- extracellular acidification rate.
REFERENCES
- 1. Hutson S. M., Sweatt A. J., Lanoue K. F. (2005) Branched-chain amino acid metabolism: implications for establishing safe intakes. J. Nutr. 135, 1557S–1564S [DOI] [PubMed] [Google Scholar]
- 2. Garber A. J., Karl I. E., Kipnis D. M. (1976) Alanine and glutamine synthesis and release from skeletal muscle. I. Glycolysis and amino acid release. J. Biol. Chem. 251, 826–835 [PubMed] [Google Scholar]
- 3. Yudkoff M., Daikhin Y., Grunstein L., Nissim I., Stern J., Pleasure D., Nissim I. (1996) Astrocyte leucine metabolism: significance of branched-chain amino acid transamination. J. Neurochem. 66, 378–385 [DOI] [PubMed] [Google Scholar]
- 4. Wallin R., Hall T. R., Hutson S. M. (1990) Purification of branched chain aminotransferase from rat heart mitochondria. J. Biol. Chem. 265, 6019–6024 [PubMed] [Google Scholar]
- 5. Hall T. R., Wallin R., Reinhart G. D., Hutson S. M. (1993) Branched chain aminotransferase isoenzymes: purification and characterization of the rat brain isoenzyme. J. Biol. Chem. 268, 3092–3098 [PubMed] [Google Scholar]
- 6. Ichihara A., Koyama E. (1966) Transaminase of branched chain amino acids: I. branched chain amino acids-α-ketoglutarate transaminase. J. Biochem. 59, 160–169 [DOI] [PubMed] [Google Scholar]
- 7. Hutson S. M., Fenstermacher D., Mahar C. (1988) Role of mitochondrial transamination in branched chain amino acid metabolism. J. Biol. Chem. 263, 3618–3625 [PubMed] [Google Scholar]
- 8. Sweatt A. J., Wood M., Suryawan A., Wallin R., Willingham M. C., Hutson S. M. (2004) Branched-chain amino acid catabolism: unique segregation of pathway enzymes in organ systems and peripheral nerves. Am. J. Physiol. Endocrinol. Metab. 286, E64–E76 [DOI] [PubMed] [Google Scholar]
- 9. Harris R. A., Popov K. M., Zhao Y., Kedishvili N. Y., Shimomura Y., Crabb D. W. (1995) A new family of protein kinases: the mitochondrial protein kinases. Adv. Enzyme Regul. 35, 147–162 [DOI] [PubMed] [Google Scholar]
- 10. Harris R. A., Zhang B., Goodwin G. W., Kuntz M. J., Shimomura Y., Rougraff P., Dexter P., Zhao Y., Gibson R., Crabb D. W. (1990) Regulation of the branched-chain α-ketoacid dehydrogenase and elucidation of a molecular basis for maple syrup urine disease. Adv. Enzyme Regul. 30, 245–263 [DOI] [PubMed] [Google Scholar]
- 11. Zhou Y., Jetton T. L., Goshorn S., Lynch C. J., She P. (2010) Transamination is required for α-ketoisocaproate but not leucine to stimulate insulin secretion. J. Biol. Chem. 285, 33718–33726 [DOI] [PMC free article] [PubMed] [Google Scholar]
- 12. Kimball S. R., Jefferson L. S. (2006) Signaling pathways and molecular mechanisms through which branched-chain amino acids mediate translational control of protein synthesis. J. Nutr. 136, 227S–231S [DOI] [PubMed] [Google Scholar]
- 13. Lynch C. J., Halle B., Fujii H., Vary T. C., Wallin R., Damuni Z., Hutson S. M. (2003) Potential role of leucine metabolism in the leucine-signaling pathway involving mTOR. Am. J. Physiol. Endocrinol. Metab. 285, E854–E863 [DOI] [PubMed] [Google Scholar]
- 14. Lynch C. J., Hutson S. M., Patson B. J., Vaval A., Vary T. C. (2002) Tissue-specific effects of chronic dietary leucine and norleucine supplementation on protein synthesis in rats. Am. J. Physiol. Endocrinol. Metab. 283, E824–E835 [DOI] [PubMed] [Google Scholar]
- 15. Avruch J., Long X., Ortiz-Vega S., Rapley J., Papageorgiou A., Dai N. (2009) Amino acid regulation of TOR complex 1. Am. J. Physiol. Endocrinol. Metab. 296, E592–E602 [DOI] [PMC free article] [PubMed] [Google Scholar]
- 16. Nicklin P., Bergman P., Zhang B., Triantafellow E., Wang H., Nyfeler B., Yang H., Hild M., Kung C., Wilson C., Myer V. E., MacKeigan J. P., Porter J. A., Wang Y. K., Cantley L. C., Finan P. M., Murphy L. O. (2009) Bidirectional transport of amino acids regulates mTOR and autophagy. Cell 136, 521–534 [DOI] [PMC free article] [PubMed] [Google Scholar]
- 17. Laplante M., Sabatini D. M. (2012) mTOR Signaling. Cold Spring Harb. Perspect Biol. 4, a011593. [DOI] [PMC free article] [PubMed] [Google Scholar]
- 18. Laplante M., Sabatini D. M. (2009) mTOR signaling at a glance. J. Cell Sci. 122, 3589–3594 [DOI] [PMC free article] [PubMed] [Google Scholar]
- 19. Delgoffe G. M., Kole T. P., Zheng Y., Zarek P. E., Matthews K. L., Xiao B., Worley P. F., Kozma S. C., Powell J. D. (2009) The mTOR kinase differentially regulates effector and regulatory T cell lineage commitment. Immunity 30, 832–844 [DOI] [PMC free article] [PubMed] [Google Scholar]
- 20. Waickman A. T., Powell J. D. (2012) mTOR, metabolism, and the regulation of T-cell differentiation and function. Immunol. Rev. 249, 43–58 [DOI] [PMC free article] [PubMed] [Google Scholar]
- 21. Cobbold S. P., Adams E., Farquhar C. A., Nolan K. F., Howie D., Lui K. O., Fairchild P. J., Mellor A. L., Ron D., Waldmann H. (2009) Infectious tolerance via the consumption of essential amino acids and mTOR signaling. Proc. Natl. Acad. Sci. U.S.A. 106, 12055–12060 [DOI] [PMC free article] [PubMed] [Google Scholar]
- 22. Sinclair L. V., Rolf J., Emslie E., Shi Y. B., Taylor P. M., Cantrell D. A. (2013) Control of amino-acid transport by antigen receptors coordinates the metabolic reprogramming essential for T cell differentiation. Nat. Immunol. 14, 500–508 [DOI] [PMC free article] [PubMed] [Google Scholar]
- 23. Zheng Y., Delgoffe G. M., Meyer C. F., Chan W., Powell J. D. (2009) Anergic T cells are metabolically anergic. J. Immunol. 183, 6095–6101 [DOI] [PMC free article] [PubMed] [Google Scholar]
- 24. Sweatt A. J., Garcia-Espinosa M. A., Wallin R., Hutson S. M. (2004) Branched-chain amino acids and neurotransmitter metabolism: expression of cytosolic branched-chain aminotransferase (BCATc) in the cerebellum and hippocampus. J. Comp. Neurol. 477, 360–370 [DOI] [PubMed] [Google Scholar]
- 25. Tönjes M., Barbus S., Park Y. J., Wang W., Schlotter M., Lindroth A. M., Pleier S. V., Bai A. H., Karra D., Piro R. M., Felsberg J., Addington A., Lemke D., Weibrecht I., Hovestadt V., Rolli C. G., Campos B., Turcan S., Sturm D., Witt H., Chan T. A., Herold-Mende C., Kemkemer R., König R., Schmidt K., Hull W. E., Pfister S. M., Jugold M., Hutson S. M., Plass C., Okun J. G., Reifenberger G., Lichter P., Radlwimmer B. (2013) BCAT1 promotes cell proliferation through amino acid catabolism in gliomas carrying wild-type IDH1. Nat. Med. 19, 901–908 [DOI] [PMC free article] [PubMed] [Google Scholar]
- 26. Goto M., Shinno H., Ichihara A. (1977) Isozyme patterns of branched-chain amino acid transaminase in human tissues and tumors. Gann 68, 663–667 [PubMed] [Google Scholar]
- 27. Cole J. T., Sweatt A. J., Hutson S. M. (2012) Expression of mitochondrial branched-chain aminotransferase and alpha-keto-acid dehydrogenase in rat brain: implications for neurotransmitter metabolism. Front. Neuroanat. 6, 18. [DOI] [PMC free article] [PubMed] [Google Scholar]
- 28. Safford M., Collins S., Lutz M. A., Allen A., Huang C. T., Kowalski J., Blackford A., Horton M. R., Drake C., Schwartz R. H., Powell J. D. (2005) Egr-2 and Egr-3 are negative regulators of T cell activation. Nat. Immunol. 6, 472–480 [DOI] [PubMed] [Google Scholar]
- 29. Huang C. T., Huso D. L., Lu Z., Wang T., Zhou G., Kennedy E. P., Drake C. G., Morgan D. J., Sherman L. A., Higgins A. D., Pardoll D. M., Adler A. J. (2003) CD4+ T cells pass through an effector phase during the process of in vivo tolerance induction. J. Immunol. 170, 3945–3953 [DOI] [PubMed] [Google Scholar]
- 30. Hutson S. M., Berkich D., Drown P., Xu B., Aschner M., LaNoue K. F. (1998) Role of branched-chain aminotransferase isoenzymes and gabapentin in neurotransmitter metabolism. J. Neurochem. 71, 863–874 [DOI] [PubMed] [Google Scholar]
- 31. Schneider C. A., Rasband W. S., Eliceiri K. W. (2012) NIH Image to ImageJ: 25 years of image analysis. Nat. Methods 9, 671–675 [DOI] [PMC free article] [PubMed] [Google Scholar]
- 32. Wu G., Knabe D. A. (1994) Free and protein-bound amino acids in sow's colostrum and milk. J. Nutr. 124, 415–424 [DOI] [PubMed] [Google Scholar]
- 33. Gerencser A. A., Neilson A., Choi S. W., Edman U., Yadava N., Oh R. J., Ferrick D. A., Nicholls D. G., Brand M. D. (2009) Quantitative microplate-based respirometry with correction for oxygen diffusion. Anal. Chem. 81, 6868–6878 [DOI] [PMC free article] [PubMed] [Google Scholar]
- 34. Broos S., Hulpiau P., Galle J., Hooghe B., Van Roy F., De Bleser P. (2011) ConTra v2: a tool to identify transcription factor binding sites across species, update 2011. Nucleic Acids Res. 39, W74–W78 [DOI] [PMC free article] [PubMed] [Google Scholar]
- 35. Crabtree G. R. (2001) Calcium, calcineurin, and the control of transcription. J. Biol. Chem. 276, 2313–2316 [DOI] [PubMed] [Google Scholar]
- 36. Michalek R. D., Rathmell J. C. (2010) The metabolic life and times of a T-cell. Immunol. Rev. 236, 190–202 [DOI] [PMC free article] [PubMed] [Google Scholar]
- 37. Wise D. R., Thompson C. B. (2010) Glutamine addiction: a new therapeutic target in cancer. Trends Biochem. Sci. 35, 427–433 [DOI] [PMC free article] [PubMed] [Google Scholar]
- 38. Carr E. L., Kelman A., Wu G. S., Gopaul R., Senkevitch E., Aghvanyan A., Turay A. M., Frauwirth K. A. (2010) Glutamine uptake and metabolism are coordinately regulated by ERK/MAPK during T lymphocyte activation. J. Immunol. 185, 1037–1044 [DOI] [PMC free article] [PubMed] [Google Scholar]
- 39. Sukumar M., Liu J., Ji Y., Subramanian M., Crompton J. G., Yu Z., Roychoudhuri R., Palmer D. C., Muranski P., Karoly E. D., Mohney R. P., Klebanoff C. A., Lal A., Finkel T., Restifo N. P., Gattinoni L. (2013) Inhibiting glycolytic metabolism enhances CD8+ T cell memory and antitumor function. J. Clin. Investig. 123, 4479–4488 [DOI] [PMC free article] [PubMed] [Google Scholar]
- 40. Ferrick D. A., Neilson A., Beeson C. (2008) Advances in measuring cellular bioenergetics using extracellular flux. Drug Discov. Today 13, 268–274 [DOI] [PubMed] [Google Scholar]
- 41. Powell J. D., Heikamp E. B., Pollizzi K. N., Waickman A. T. (2013) A modified model of T-cell differentiation based on mTOR activity and metabolism. Cold Spring Harbor Symp. Quant. Biol., 10.1101/sqb.2013.78.020214 [DOI] [PMC free article] [PubMed] [Google Scholar]
- 42. Zha X., Sun Q., Zhang H. (2011) mTOR upregulation of glycolytic enzymes promotes tumor development. Cell cycle 10, 1015–1016 [DOI] [PubMed] [Google Scholar]
- 43. Abraham R. T., Wiederrecht G. J. (1996) Immunopharmacology of rapamycin. Annu. Rev. Immunol. 14, 483–510 [DOI] [PubMed] [Google Scholar]
- 44. Hidayat S., Yoshino K., Tokunaga C., Hara K., Matsuo M., Yonezawa K. (2003) Inhibition of amino acid-mTOR signaling by a leucine derivative induces G1 arrest in Jurkat cells. Biochem. Biophys. Res. Commun. 301, 417–423 [DOI] [PubMed] [Google Scholar]
- 45. Lynch C. J., Fox H. L., Vary T. C., Jefferson L. S., Kimball S. R. (2000) Regulation of amino acid-sensitive TOR signaling by leucine analogues in adipocytes. J. Cell. Biochem. 77, 234–251 [DOI] [PubMed] [Google Scholar]
- 46. Choo A. Y., Yoon S. O., Kim S. G., Roux P. P., Blenis J. (2008) Rapamycin differentially inhibits S6Ks and 4E-BP1 to mediate cell-type-specific repression of mRNA translation. Proc. Natl. Acad. Sci. U.S.A. 105, 17414–17419 [DOI] [PMC free article] [PubMed] [Google Scholar]
- 47. Li P., Yin Y. L., Li D., Kim S. W., Wu G. (2007) Amino acids and immune function. Br. J. Nutr. 98, 237–252 [DOI] [PubMed] [Google Scholar]
- 48. Powell J. D. (2013) Slc7a5 helps T cells get with the program. Nat. Immunol. 14, 422–424 [DOI] [PubMed] [Google Scholar]
- 49. Mellor A. L., Munn D. H. (2004) IDO expression by dendritic cells: tolerance and tryptophan catabolism. Nat. Rev. Immunol. 4, 762–774 [DOI] [PubMed] [Google Scholar]
- 50. Bronte V., Zanovello P. (2005) Regulation of immune responses by l-arginine metabolism. Nat. Rev. Immunol. 5, 641–654 [DOI] [PubMed] [Google Scholar]
- 51. Peranzoni E., Marigo I., Dolcetti L., Ugel S., Sonda N., Taschin E., Mantelli B., Bronte V., Zanovello P. (2007) Role of arginine metabolism in immunity and immunopathology. Immunobiology 212, 795–812 [DOI] [PubMed] [Google Scholar]
- 52. Rodriguez P. C., Quiceno D. G., Zabaleta J., Ortiz B., Zea A. H., Piazuelo M. B., Delgado A., Correa P., Brayer J., Sotomayor E. M., Antonia S., Ochoa J. B., Ochoa A. C. (2004) Arginase I production in the tumor microenvironment by mature myeloid cells inhibits T-cell receptor expression and antigen-specific T-cell responses. Cancer Res. 64, 5839–5849 [DOI] [PubMed] [Google Scholar]
- 53. Mittal D., Kassianos A. J., Tran L. S., Bergot A. S., Gosmann C., Hofmann J., Blumenthal A., Leggatt G. R., Frazer I. H. (2013) Indoleamine 2,3-dioxygenase activity contributes to local immune suppression in the skin expressing human papillomavirus oncoprotein e7. J. Invest. Dermatol. 133, 2686–2694 [DOI] [PMC free article] [PubMed] [Google Scholar]
- 54. Rao A., Luo C., Hogan P. G. (1997) Transcription factors of the NFAT family: regulation and function. Annu. Rev. Immunol. 15, 707–747 [DOI] [PubMed] [Google Scholar]
- 55. Zhou W., Feng X., Ren C., Jiang X., Liu W., Huang W., Liu Z., Li Z., Zeng L., Wang L., Zhu B., Shi J., Liu J., Zhang C., Liu Y., Yao K. (2013) Over-expression of BCAT1, a c-Myc target gene, induces cell proliferation, migration and invasion in nasopharyngeal carcinoma. Mol. Cancer 12, 53. [DOI] [PMC free article] [PubMed] [Google Scholar]
- 56. She P., Reid T. M., Bronson S. K., Vary T. C., Hajnal A., Lynch C. J., Hutson S. M. (2007) Disruption of BCATm in mice leads to increased energy expenditure associated with the activation of a futile protein turnover cycle. Cell Metab. 6, 181–194 [DOI] [PMC free article] [PubMed] [Google Scholar]
- 57. Suryawan A., Hawes J. W., Harris R. A., Shimomura Y., Jenkins A. E., Hutson S. M. (1998) A molecular model of human branched-chain amino acid metabolism. Am. J. Clin. Nutr. 68, 72–81 [DOI] [PubMed] [Google Scholar]
- 58. Harris R. A., Joshi M., Jeoung N. H., Obayashi M. (2005) Overview of the molecular and biochemical basis of branched-chain amino acid catabolism. J. Nutr. 135, 1527S–1530S [DOI] [PubMed] [Google Scholar]
- 59. Pearce E. L. (2010) Metabolism in T cell activation and differentiation. Curr. Opin. Immunol. 22, 314–320 [DOI] [PMC free article] [PubMed] [Google Scholar]
- 60. Lunt S. Y., Vander Heiden M. G. (2011) Aerobic glycolysis: meeting the metabolic requirements of cell proliferation. Annu. Rev. Cell Dev. Biol. 27, 441–464 [DOI] [PubMed] [Google Scholar]
- 61. Jones R. G., Thompson C. B. (2007) Revving the engine: signal transduction fuels T cell activation. Immunity 27, 173–178 [DOI] [PubMed] [Google Scholar]
- 62. Frauwirth K. A., Thompson C. B. (2004) Regulation of T lymphocyte metabolism. J. Immunol. 172, 4661–4665 [DOI] [PubMed] [Google Scholar]
- 63. Newsholme P. (2001) Why is l-glutamine metabolism important to cells of the immune system in health, postinjury, surgery or infection? J. Nutr. 131, 2515S–2522S; discussion 2523S–2514S [DOI] [PubMed] [Google Scholar]
- 64. Kaesler S., Sobiesiak M., Kneilling M., Volz T., Kempf W. E., Lang P. A., Lang K. S., Wieder T., Heller-Stilb B., Warskulat U., Häussinger D., Lang F., Biedermann T. (2012) Effective T-cell recall responses require the taurine transporter Taut. Eur. J. Immunol. 42, 831–841 [DOI] [PubMed] [Google Scholar]
- 65. Possemato R., Marks K. M., Shaul Y. D., Pacold M. E., Kim D., Birsoy K., Sethumadhavan S., Woo H. K., Jang H. G., Jha A. K., Chen W. W., Barrett F. G., Stransky N., Tsun Z. Y., Cowley G. S., Barretina J., Kalaany N. Y., Hsu P. P., Ottina K., Chan A. M., Yuan B., Garraway L. A., Root D. E., Mino-Kenudson M., Brachtel E. F., Driggers E. M., Sabatini D. M. (2011) Functional genomics reveal that the serine synthesis pathway is essential in breast cancer. Nature 476, 346–350 [DOI] [PMC free article] [PubMed] [Google Scholar]
- 66. Han J. M., Jeong S. J., Park M. C., Kim G., Kwon N. H., Kim H. K., Ha S. H., Ryu S. H., Kim S. (2012) Leucyl-tRNA synthetase is an intracellular leucine sensor for the mTORC1-signaling pathway. Cell 149, 410–424 [DOI] [PubMed] [Google Scholar]
- 67. Powell J. D., Pollizzi K. N., Heikamp E. B., Horton M. R. (2012) Regulation of immune responses by mTOR. Annu. Rev. Immunol. 30, 39–68 [DOI] [PMC free article] [PubMed] [Google Scholar]