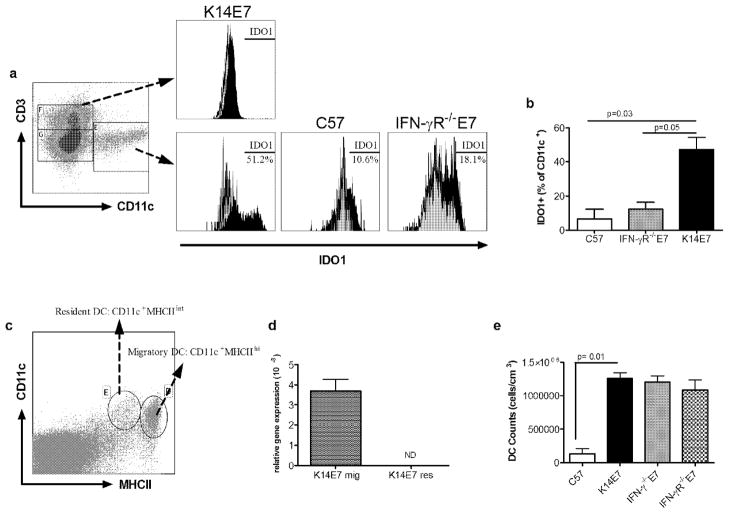
Figure 4. Dendritic cell infiltrates in K14E7 skin express IDO1 that is dependent on IFN-γR on DCs.
(a) Flow cytometry plot showing CD3 and CD11c staining (left) on the skin cells pregated on CD45+ live cells. Histogram plot showing intracellular staining for IDO1 (filled black histogram) and isotype controls (filled grey histogram) in CD3+ lymphocytes and CD11c+ cells from K14E7, C57 and IFN-γR−/−E7 mice. (b) Bar graph shows representative FACS data as the percentage of IDO1 positive DCs in the skin of C57, K14E7 and IFN-γR−/−E7 mice. (mean + SEM; n = 4 mice per group for K14E7 and IFN-γ−/−E7; n= 6 for C57 mice). (c) FACS plot showing gating strategy for sorting resident (CD11c+MHCint) and migratory (CD11c+MHChi) DCs. (d) mRNA expression of IDO1 relative to RPLL32 by real-time PCR in the resident and migratory DCs sorted from the skin draining lymph nodes of K14E7 mice. ND= not detectable. (e) Bar graph shows absolute number of MHCII+CD11c+ DCs (representative of FACS data) in the ear skin of C57, K14E7, IFN-γ−/−E7 and IFN-γR−/−E7 mice.

