
Figure 1. FOXA1 and FOXA2 expression in human PDA samples.
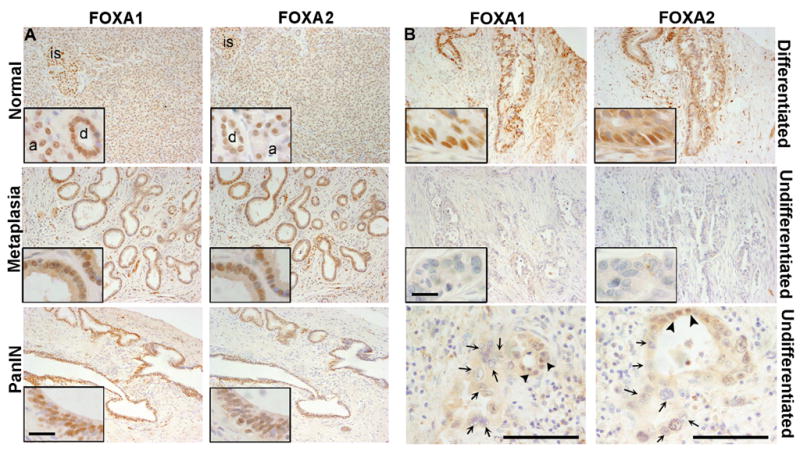
Human PDA samples were assessed for FOXA1 and FOXA2 by immunohistochemistry (IHC) shown in (A) nearby normal epithelia, metaplasia and PanIN lesions, and (B) well-differentiated or undifferentiated PDA. Note strong nuclear staining for FOXA1/2 in all the stages except in undifferentiated PDA. Undifferentiated cancer cells with large atypical nuclei (arrows) were consistently negative for both FOXA1 and FOXA2, in contrast to the positive staining of nearby moderately differentiated cancer cells (arrow heads). Scale bars = 100 μm in the main pictures and 50 μm for the insets. Representative images are shown from 24 human PDA specimens. is: islet; a: acini; d: duct.