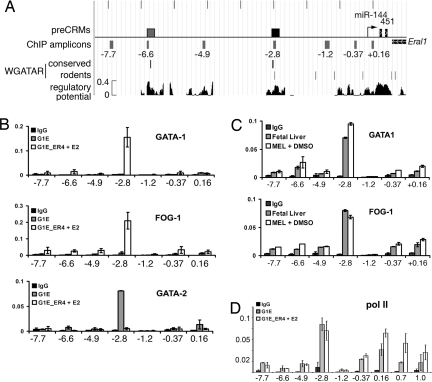
Fig. 2.
The miR 144/451 locus is directly activated by GATA-1. (A) Features of the miR 144/451 locus and 5′ flanking DNA. A 10-kb region of mouse chromosome 11 (mm8 assembly) is annotated with the DNA encoding miRNAs (thin black rectangles), the transcription start (bent arrow), and the 3′ end of the adjacent Eral1 gene located telomeric to the miRNA locus. PreCRMs (27) and amplicons used in ChIP assays in B and C are shown as rectangles above and below the line, respectively, with the positions of the amplicons relative to the transcription start given in kilobases (SI Table 3). The −2.8-kb preCRM validated in ChIP (B–D) and enhancer assays (Fig. 3) is shown in black. The positions of GATA consensus binding motifs (WGATAR), either conserved in mammals or present only in rodents, are indicated as vertical lines. The track labeled “regulatory potential” plots sequence similarity to alignment patterns in known regulatory regions (28). (B) Quantitative ChIP analysis of the locus in G1E (no GATA-1) and G1E-ER4 cells treated with estradiol (E2) for 24 h (activated GATA-1). The relative occupancies of GATA-1, FOG-1, and GATA-2 are indicated as vertical bars. As a negative control, ChIP experiments were performed with isotype-matched preimmune IgG. The bar graphs show averages of three independent ChIP experiments. Error bars represent standard deviation. (C) Quantitative ChIP analysis for GATA-1 and FOG-1 in primary fetal liver cells (embryonic day 14) and MEL cells induced to mature with HMBA, performed as in B. (D) Quantitative ChIP analysis of RNA pol II binding to the miR 144/451 locus, performed as in B. Amplicons labeled 0.7 and 1.0, not shown in A, extend into the transcribed region and are designated according to the distance (in kilobases) from the start of transcription.

